This page describes basic aspects of the climate of Australia. It is intended for natural history travelers – not meteorologists.
For SW Australia some monthly mean histograms of precipitation are shown below. The map below shows the April-Nov mean precipitation for Western Australia. This is the rainy season for SW Australia. The bold letters on the map indicate the locations of the towns in the monthly climate diagrams that follow.
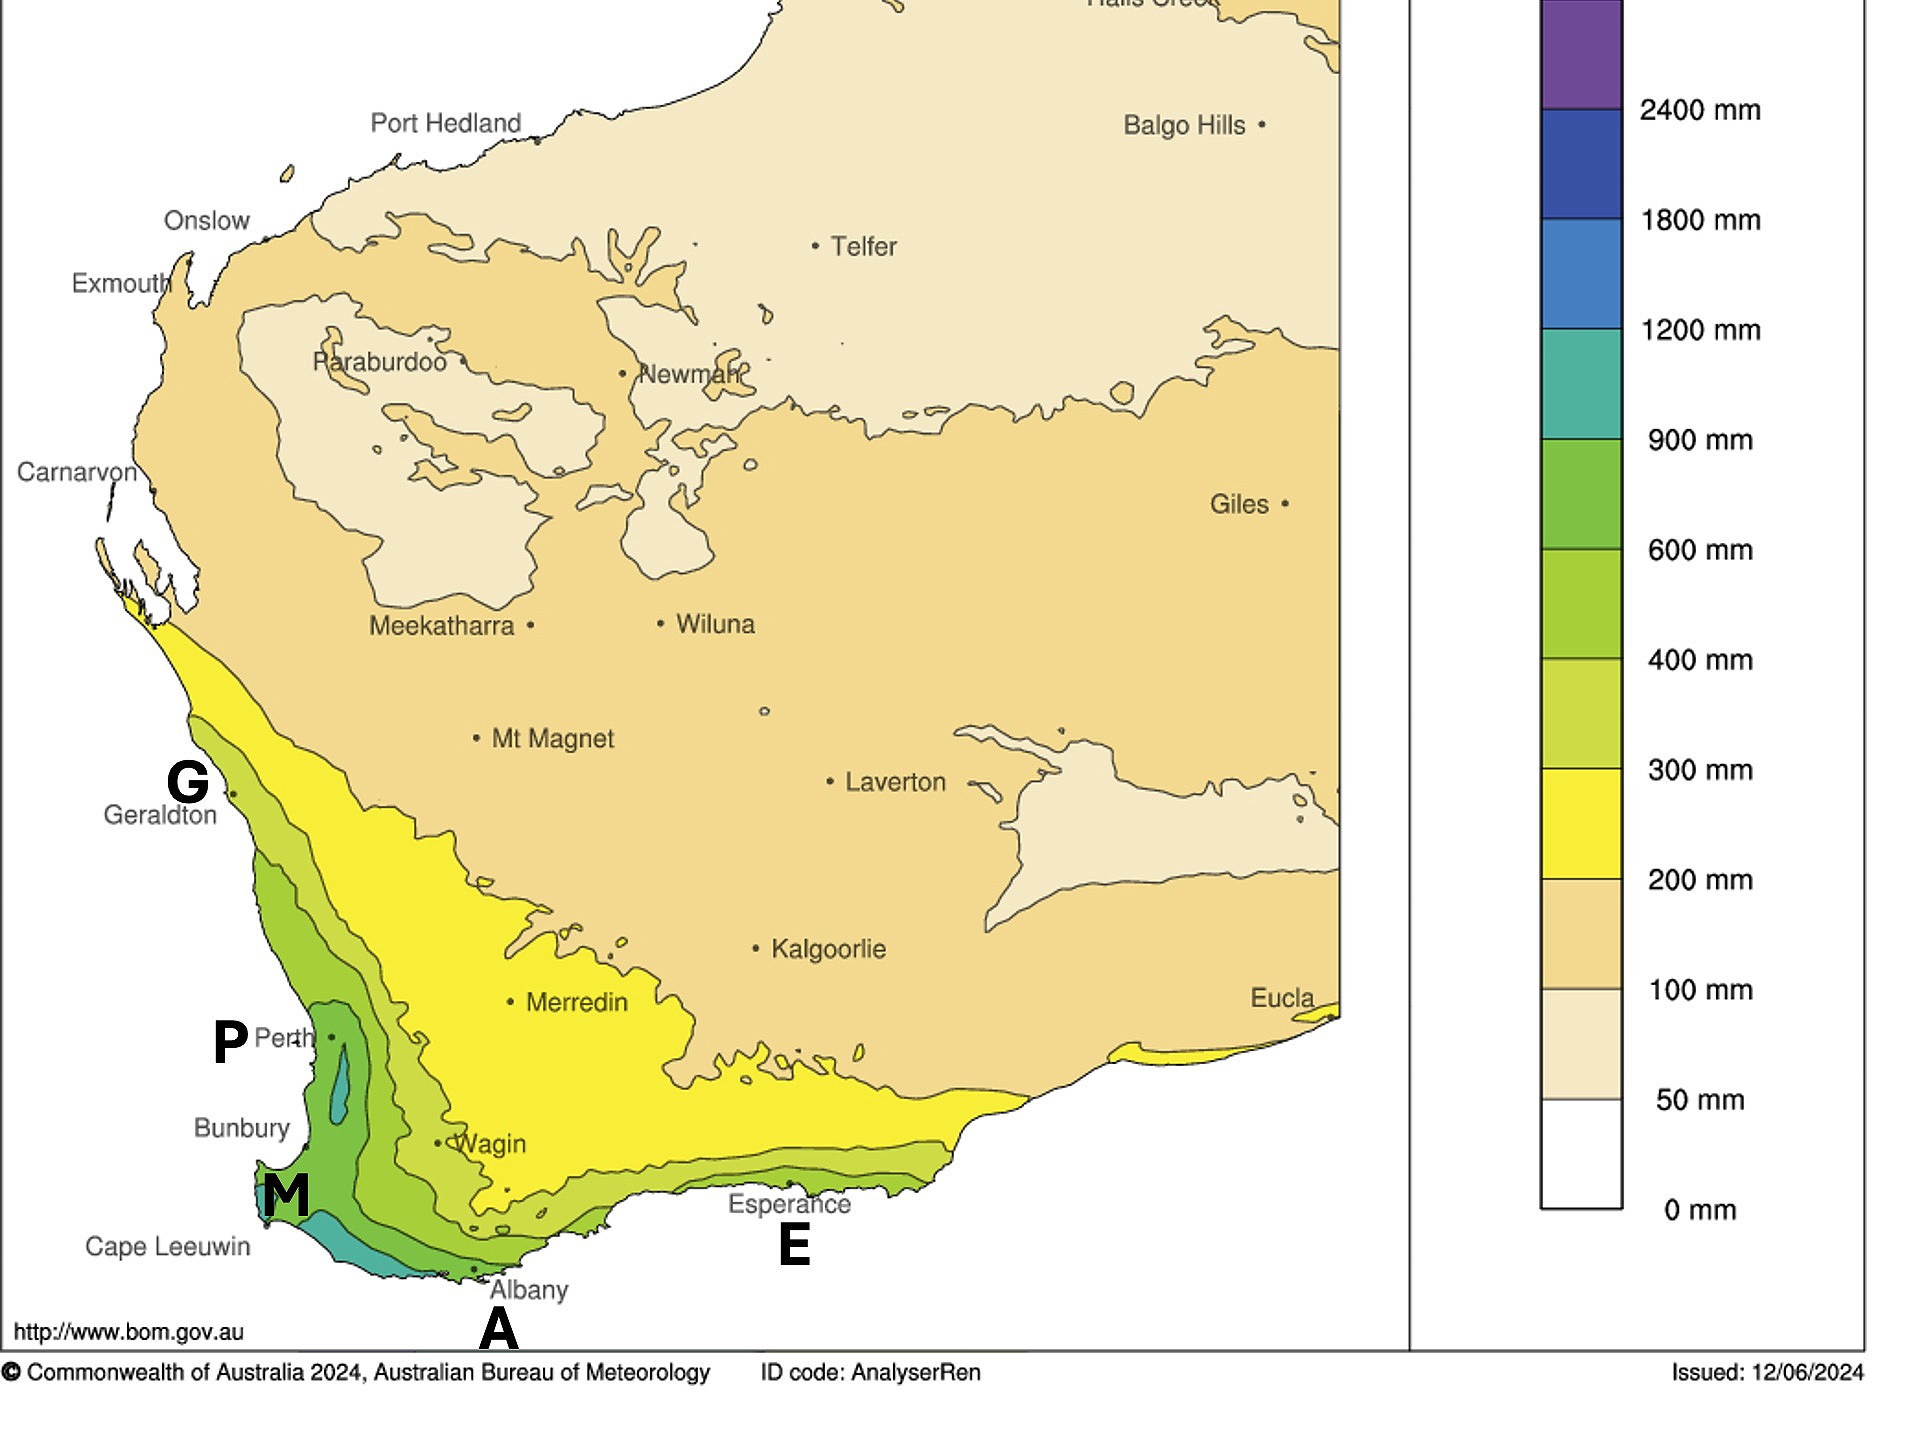
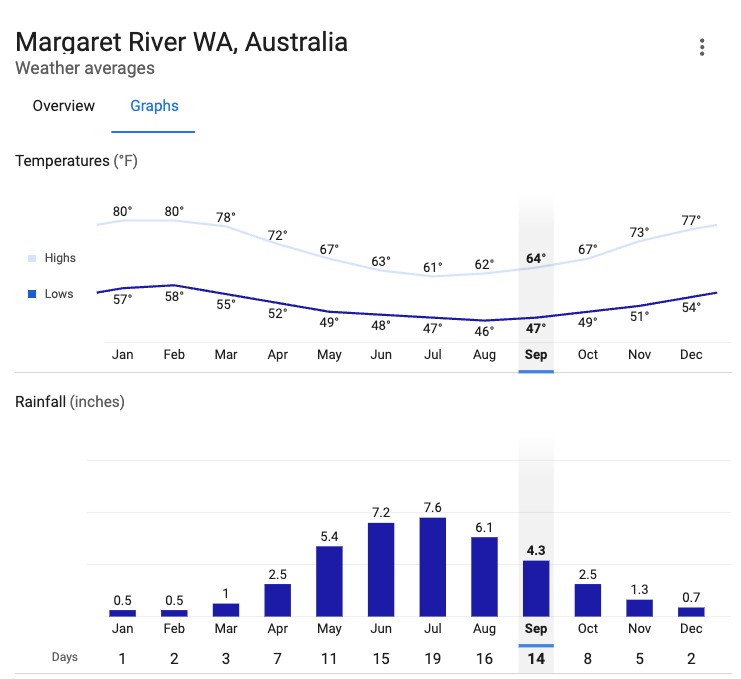
Below are climate diagrams showing monthly mean temperature(average between high and low temps,˚F) and precipitation (inches). The stations are arranged from North to South, indicating that the precipitation increases, and temperature decreases, as one proceeds poleward. This is a typical “Mediterranean climate” with cool wet winters and dry summers.


Below are climate diagrams showing monthly mean temperature(average between high and low temps,˚F) and precipitation (inches). The stations are arranged now from West to East, indicating that the precipitation decreases eastward. There is little temperature at these near-coastal stations.


Note that the two averages above are not strictly independent – the one on the left has months that represent the wet season in northern Australia and the one on the right the wet season in southern Australia. They slightly overlap in months. But the inverse relation between rain in the north and the south is obvious.
A few more climate-related maps are shown below. Their explanations accompany each map.


