This page is to explain the concept of biodiversity in a manner that is clear to the public. It is a term widely used, but relatively poorly understood and certainly not sufficiently appreciated. The concepts of biodiversity and biogeography are related, but not interchangeable. Biogeography is the study of where life forms live on Earth and why. It is a science much like ecology, zoology, botany, geology or any other of the “ologies“. Biogeographical research can be used to explain the biodiversity patterns on Earth.
Defining biodiversity
Biodiversity is short for biological diversity. The term doesn’t mean much without some reference to an area or type of biota (short term for any life form – plant, animal, fungi etc.) that one is referring to. For example, one can refer to the “biodiversity” of the hillside next to my house, or to the “biodiversity” of the planet Earth. They obviously include different types and numbers of biota. So “biodiversity” needs to refer to some geographical area to have much meaning. For much of the public the region is usually the entire Earth. But one can refer to the biodiversity of Norman, to the state Oklahoma, to the United States or to North America. They all differ in the total number of species of plants, animals, fungi etc. that they contain.
Although the term biodiversity most commonly refers to the total diversity of biota found in a region, it can also refer to subgroups of biota. For example, the biodiversity of trees, or the biodiversity of snakes, of California. It can even be used to refer to smaller biotic groups like the biodiversity of hawks in North America. The characteristics of organisms can also be used to categorize “biodiversity”. One can count the number of species in a region that possess some particular feature – like plants that use other plants for support. Thus, we can discuss the biodiversity of epiphytes of Ecuador. Or of bats that eat fruit in Australia – the biodiversity of frugivorous bats of Australia. Or birds that eat primarily insects in Oklahoma – the insectivorous birds of Oklahoma.
In summary, the use of the term “biodiversity” can refer to either a region or a group of organisms. If nothing specific is mentioned, the term biodiversity usually refers to all biota over the entire Earth. This is the most common usage among the public.
Unfortunately, the use of the phrase “save biodiversity” is somewhat like the phrase “protect the environment”. It oversimplifies many issues associated with the “biodiversity crisis”.
How does one measure biodiversity?
Biodiversity is scale-dependent, that is the amount of life forms that one can count depends on the region you are considering. For example, a particular county in any US state will be less biodiverse than that of the entire state.
Some countries are more biodiverse than others – even if they are small. For example, Costa Rica is an ornithologically biodiverse country with about 920 species of birds recorded. It is about 200 times smaller than Canada which has about 425 species recorded. Biodiversity isn’t necessarily related to the area of a country, but rather the diversity of habitats that the country posesses.

Even within biodiverse countries, the diversity varies strongly with location. It is the number of different habitats that usually determines the biodiversity of a country. A very biodiverse country does not mean that every hillside or valley is rich in species. A dry, rocky outcrop or a coastal salt flat will have less biodiversity compared with a moist evergreen forest location. It may be that such a country has a great many such micro-habitats, each not particularly rich in species, but the cumulative effect is that the country has high total biodiversity. This is well-known to birders – advertising by some ecotourism operators often implies that all species in their tour’s destination are just waiting to be seen after stepping off the plane! The birders may have seen more species on a particular hillside in their home country that they will see at any location in a “biodiverse” country. It is just that the diversity of environments in countries like Costa Rica, ranging from high/cold mountains to tropical lowlands, is greater than most mid-latitude countries without such a range of climatic conditions.
Hotspots
A widely-used concept in conservation biology is that of “hotspots“. This term can be defined precisely, like that by the Critical Ecosystem Partnership Fund (CREF) that defines a hotspot as having more than 1500 endemic vascular plant species and 70% of the original land cover already has been lost. Endemic species are those found in a limited region and nowhere else. As with biodiversity, the concept of endemism is relative. All biota are endemic to the planet Earth. A great many species are endemic to North America. A much smaller number are endemic to the state of Florida, and probably very few (possibly no) species are endemic to the smallest county in Florida.
In a nutshell, hotspots are regions that are relatively rich in endemic species and threatened by human activities.
Hotspot can be a useful term, or one that is overly broad. For example, the “Andean hotspot” includes environments ranging from glaciers to tropical lowland forests with dry valleys between the two. This variety of environments naturally has led to a great many species being found in the “hotspot”. In this case a finer subdivision of the environments is justified.
The figure (and text describing it) below have been copied verbatim from Wikipedia.
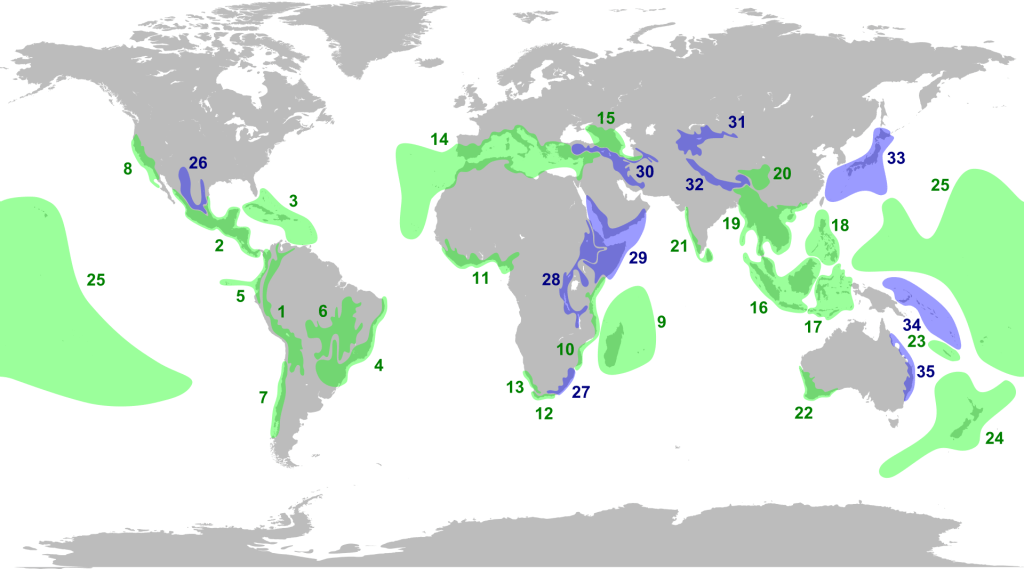
When looking at a global map of hotspots it is easy to think that the entire earth is covered by “hotspots”. It may be useful to consider the areas that aren’t hotspots. Most of the Sahara Desert is not biodiverse and has relatively few plant species. Most of Canada and Russia lack large numbers of species of plants and most are not threatened. Northern Europe and most of the US does not have large numbers of endemic species, or the natural habitat has not been greatly reduced – though there are many local exceptions to this. Most of interior Australia is not a hotspot, lacking both high endemism and major threats. Surprising is the observation that much of the Amazon basin forest is not a hotspot. This is because the lack of topography allows many species to have large geographical ranges and most of the forest has not yet been lost to agriculture or ranching activities.
In summary, hotspots tend to be closely associated with major topographic features that restrict many species to small geographical ranges. Such mountainous areas have a larger variety of climatic conditions in a smaller area and this favors the evolution of species endemic to such localized conditions.
What determines biodiversity?
Climate is the main factor
The single most important factor in determining biodiversity is climate. Period. Without precipitation there would be almost no biodiversity and an example of this is the drier parts of the Atacama where essentially zero rain falls and where almost no vegetation occurs. There is also very little surface biodiversity in the high Arctic and Antarctica away from the coast. Surface temperature in these regions controls what life forms can live on the surface.
The climate of a location is of course tied to the altitude above sea level, the latitude of the site and whether it is in a valley or on a mountain top. These factors affect the ultimate climate of the location in ways I won’t discuss here.
Geological substrate
The type of underlying rock – coupled with the climatic conditions – greatly affects what type of vegetation will develop on a landscape. For example, granite weather differently from limestone and different from shale or sandstone. The parent rock (the unmodified rock beneath the surface of the Earth) determines, together with the climate, what kind of soil will develop. Thus, in regions with high geodiversity (many rock types) there is likely to be a greater variety of plants (and thus animals) specialized to take advantage of the various soil conditions. Volcanic islands like the Hawaiian Islands or the Canary Islands have a minimum of geodiversity (mostly basaltic composition volcanic rock) while continental margins like California or the Alps have many rock types, including different sedimentary, metamorphic, and plutonic rocks. These regions have a greater variety of plants specialized to survive in the soils that develop on such parent rocks. The biodiversity in these regions is generally greater than similar climatic regions with less geodiversity.
Geological and biological history
The biodiversity of a region depends on the history of the region. Have new species recently (in geological time) migrated into the area and are these eliminating older species that inhabited the area? Was there a recent extinction event due to some natural disaster like a volcanic eruption, asteroid impact, or the drying up of a large water body? Did early man kill off some of the large land mammals? How did climatic changes associated with the last ice age affect the current biodiversity of a region?
The important history can go back a long time. Madagascar has many unique biota because it separated from Africa something like 135 million years ago and its flora and fauna has been evolving mostly independently since then. Plate tectonic knowledge is needed to explain many geographical patterns over the past 100 million or more years. Of course, geological knowledge, in particular the distributions of continental fragments, is quite limited for the really distant past – most of the Earth’s four billion year history.
Inter-species interactions
Implicit in the above discussion was that new species moving into a region in the distant past could have had a profound impact on the current biodiversity of the region. Natural events, like the sea level reduction by about 100m during the last ice age, created land bridges between Siberia and Alaska, southeast Asia and much of western Indonesia, and between New Guinea and Australia. This greatly increased the exchange of land-based animals and many plants between these regions. Some species likely suffered, unable to compete successfully with the newcomers. The same happened about 3 million years ago when North and South America merged near Panama after a long separation, resulting in the elimination of many mammals that were previously restricted to South America.
Although natural processes associated with glacial cycles and plate tectonic movements have had a very long impact on the Earth’s spatial distribution of biodiversity, human influences have dominated the past ten thousand years. For example, when humans entered North America from Asia more than 12,000 years ago, they brought knowledge of hunting. These skills likely were associated with the extinction of many of the larger land mammals present in North America at the time. In Australia, the early Aborigines brought from New Guinea knowledge of fire and hunting, as well as a likely companion – the dog (Dingo). Together, these had a major impact on the flora and fauna of Australia. And in very recent years modern mankind has hunted to extinction many species across the world, most notably the Passenger Pigeon in North America, a bird that once numbered many millions. Many species have had their numbers reduced to very small fractions of their former abundance, either through hunting or modification of their most suitable habitat. Only in the last 50 years or so have we entered an era of “environmental enlightenment” where widespread attempts are being made to minimize the ongoing onslaught to global biodiversity. Unfortunately, if this awareness was truly widespread it would not be necessary to prepare the material being discussed here.
How do we map biodiversity?
In principle we can map the biodiversity by overlapping all maps of individual species occurrence over each other and counting the number of species within our chosen area. But how do we develop these species distribution maps? There are many techniques, but all depend on observations. And these observations are often fraught with errors. In addition, a great many species on Earth, likely the vast majority, are simply not routinely observed.
Most observations of nature, and usually the most reliable, have been made by scientists or explorers who collected specimens for museums over the past few hundred years. Plant specimens reside in herbaria in a very large number of educational and research institutions worldwide, as do specimens of birds, insects, and all other life forms. In recent years these collections have been coordinated and digitized to a fair degree so that specimens can be searched via the internet. Such “voucher specimens” are the basis of most classification schemes for plants and animals (the subject of taxonomy).
Although collections made by specialists who know what to collect and how to document them are the most reliable sources of “observations”, they are expensive to make and there are not enough specialists to make the observations/collections everywhere they are needed. Researchers don’t spend most of their time in the field collecting because lab and office work is also required. It is costly to carry out expeditions to remote areas. Air fares, helpers in the field, special equipment etc. For this reason, among others, researchers have an interest in citizen science naturalists who can help to make field observations to support their research studies. Additional observers can, in principle, help with many biogeographical studies by making supplementary observations – especially related to where organisms are found.
Observations can have many types of errors, though some are becoming less common as technology advances. Old observations (prior to GPS) often had erroneous positions that could be quite large. Really old observations are practically useless for mapping a species’ range with positions like “Texas, west of the Pecos” or “in New Spain”. New observations, made with cell phones that have GPS, can be accurate to within a few meters. This high accuracy can be disadvantageous for rare species that are fixed in place like plants. If the position is made public unscrupulous plant collectors may travel to the site to collect them.
Precise observations of birds can lead to observational biases that favor the increased observation of rare birds. Most eBird participants know that when a rare bird is sighted near them, an alert is posted. This encourages other birders to try to see the bird. The result is a clustering of observations about the same bird – or group of birds – at a particular location. This draws potential observers away from sampling other places where the birds might have been. Of course, this only works when the bird or birds are relatively stationary for many days, such as those that come to a particular lake, mud flat or feeder.
Common biases in citizen science data
People observe mostly near where they live
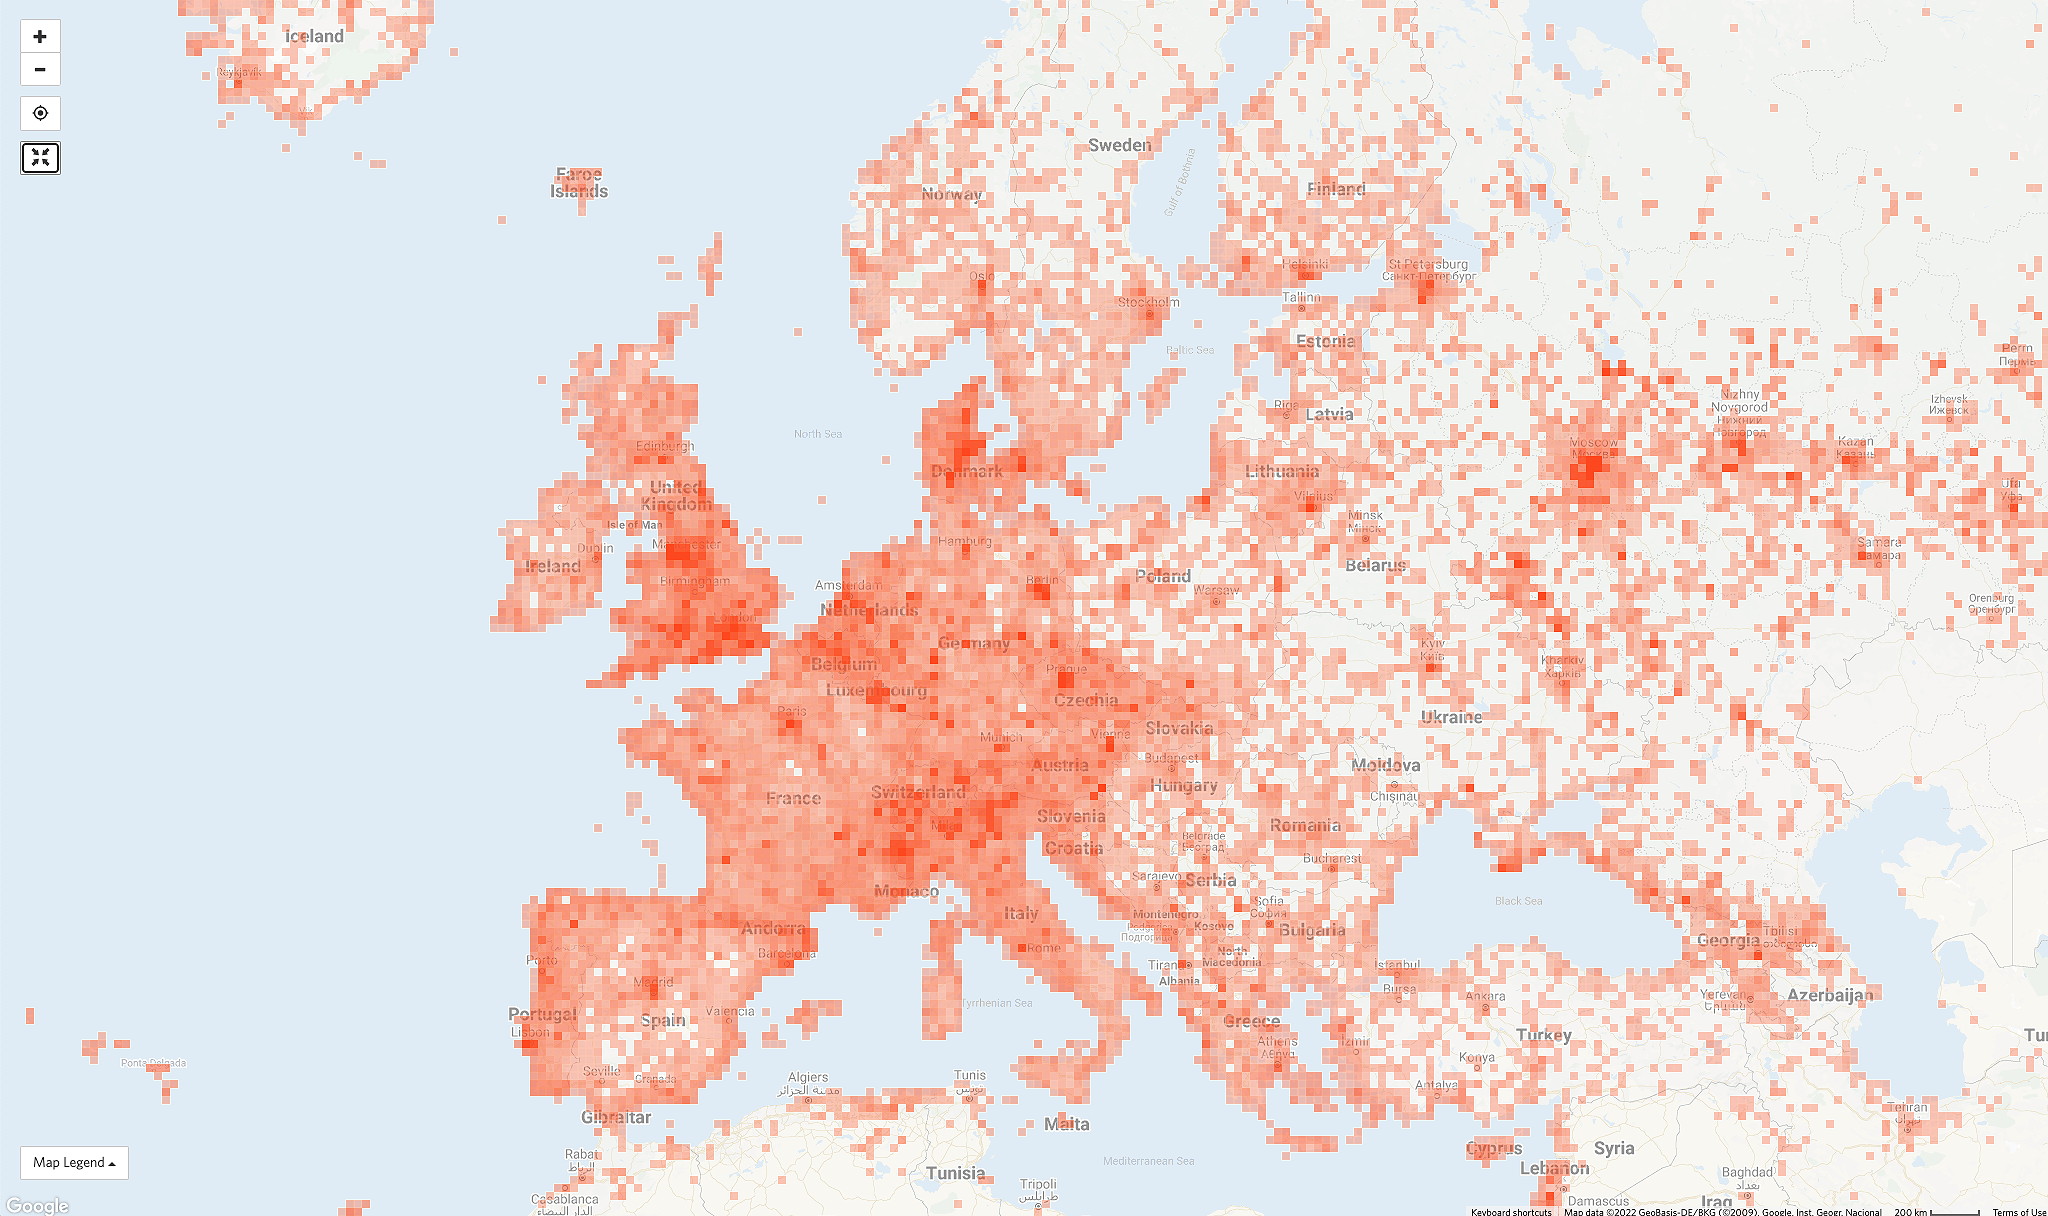
Due to the cost of transportation in fuel and time most people make citizen science observations close to where they live. This means that such observations are nearly coincident with centers of population. One can see this with any iNaturalist or eBird plot.
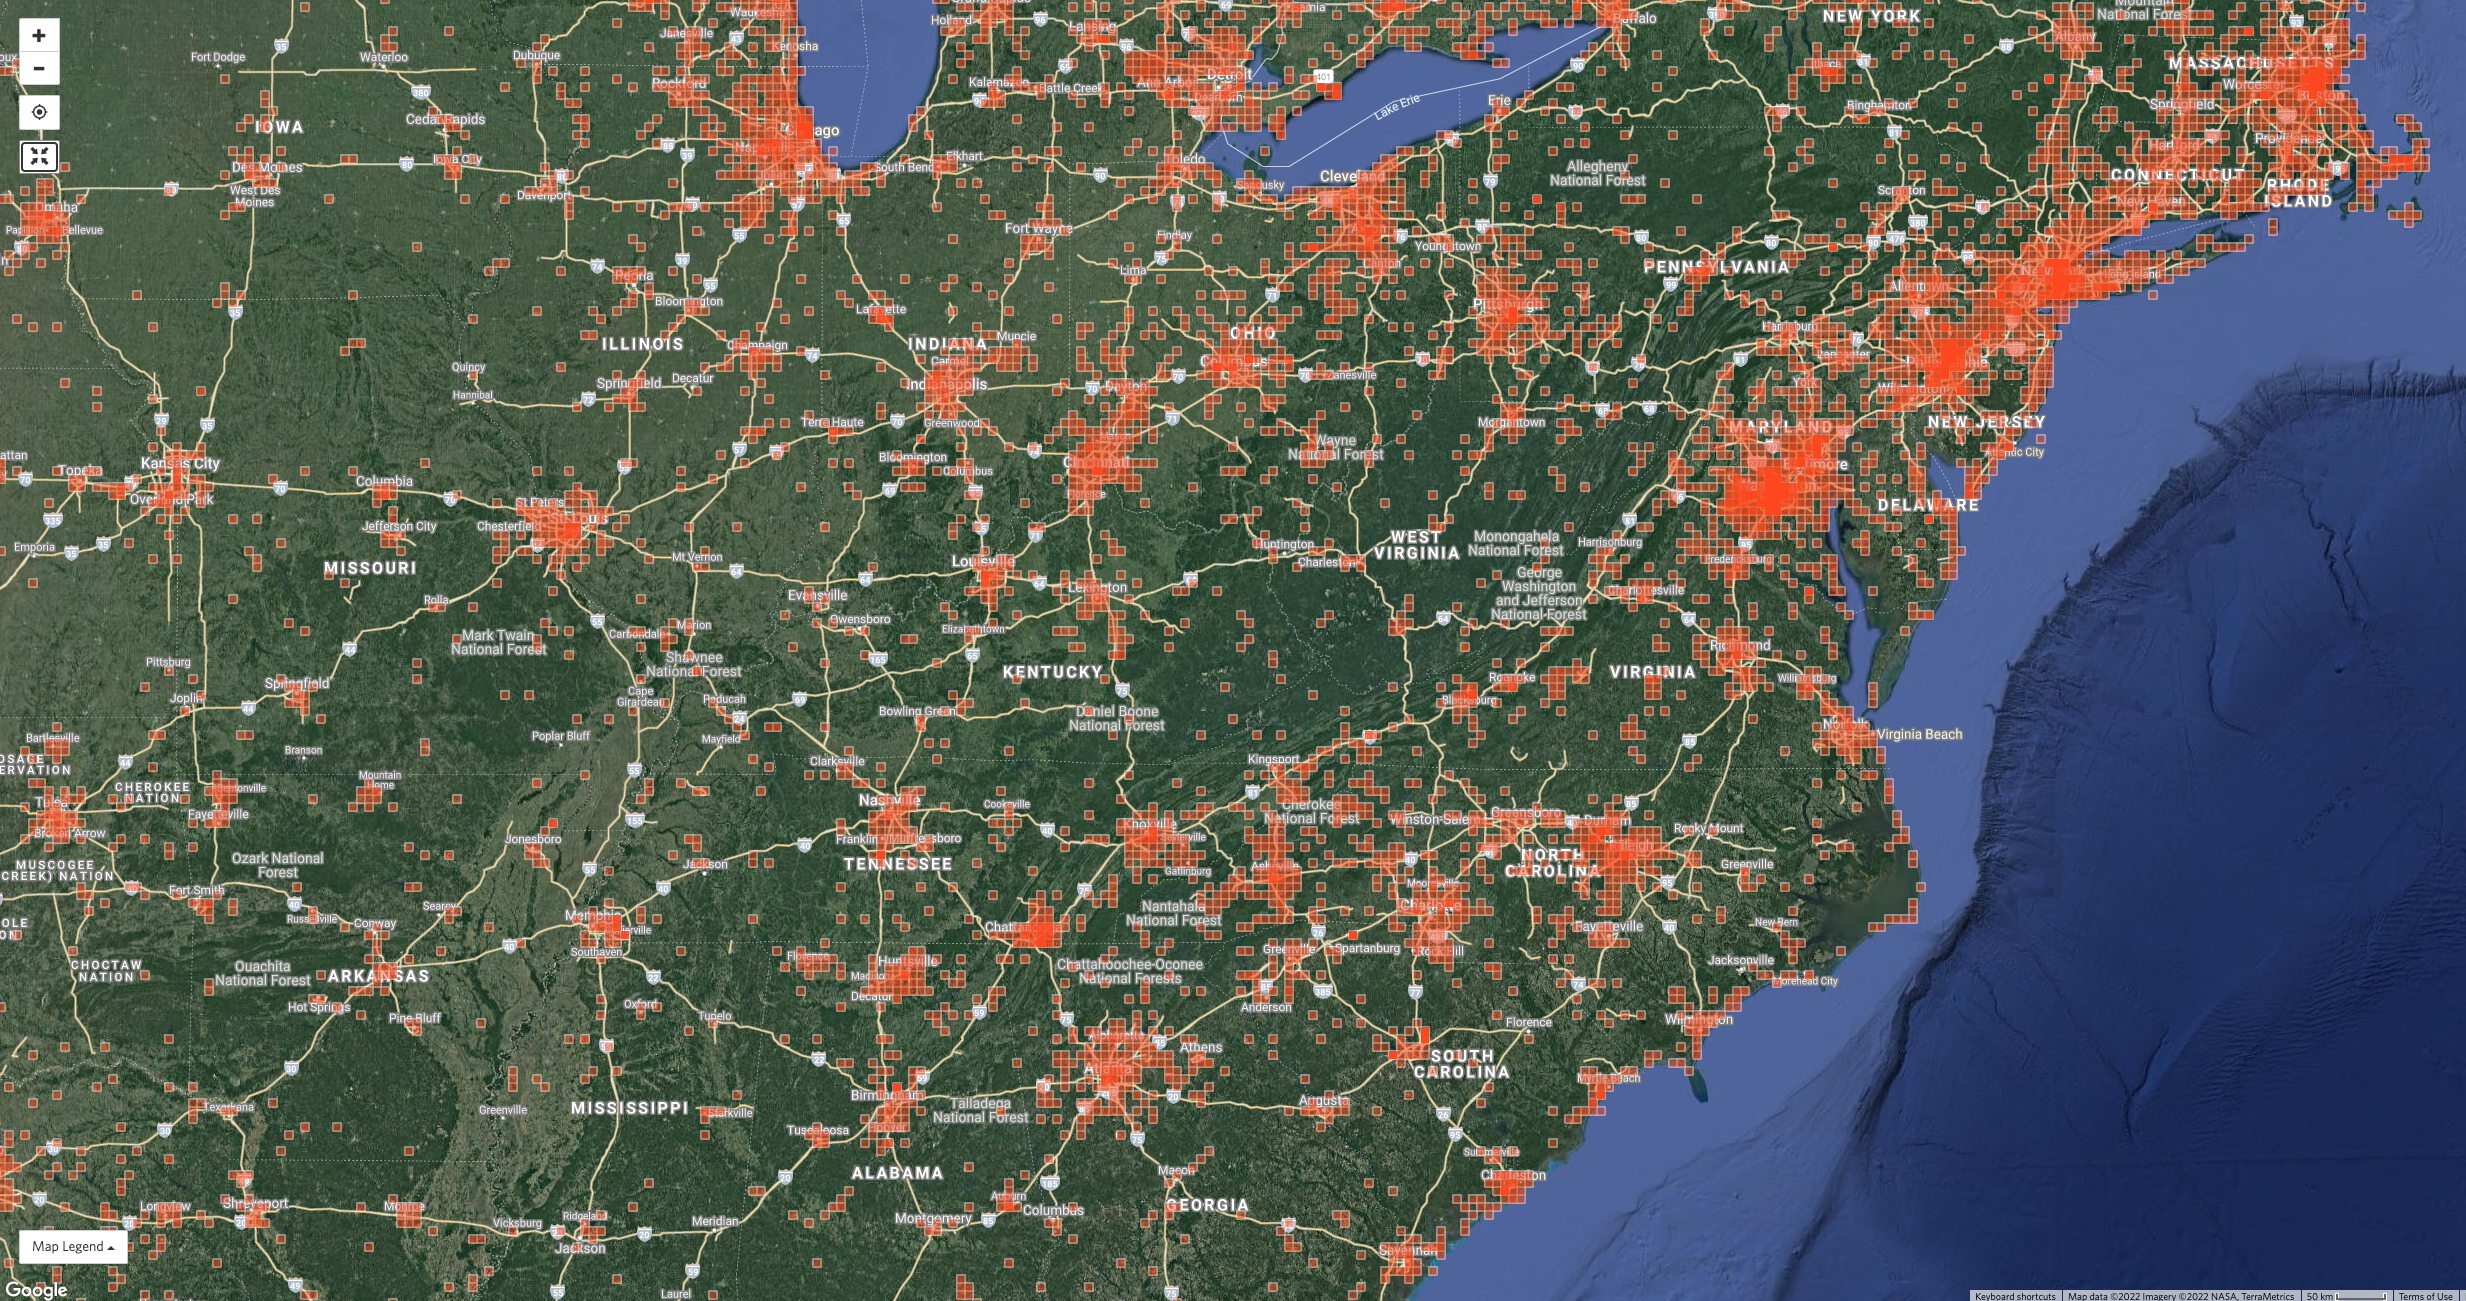
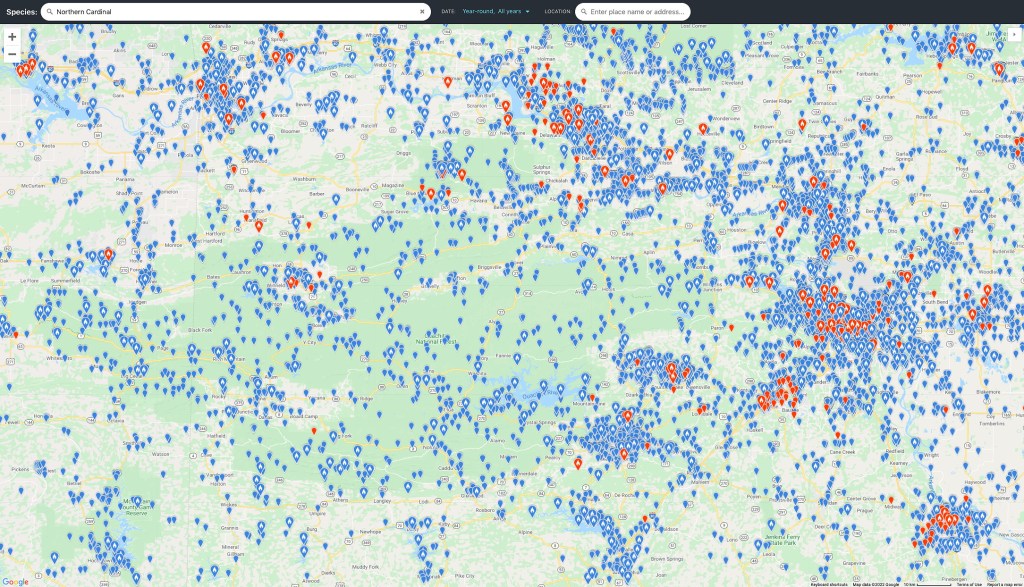
Parks and nature reserves draw the most visitors and thus observations
A fundamental sampling issue with eBird, iNaturalist or other nature-observation activities is that these observations are usually made by people who travel to see nature. Such individuals don’t want to spend their time and money traveling to locations not known for interesting aspects of the natural world. Birders don’t usually choose to visit “non-birdy” areas. They prefer parks and nature reserves know for the variety of birds and the ease of seeing them. Nature reserves, parks and wildlife refuges usually have some basic facilities like trails, boardwalks or possibly visitor centers. Camping or hotel facilities are often nearby, especially near State or National Parks. Having trails or roads that access nature is important.
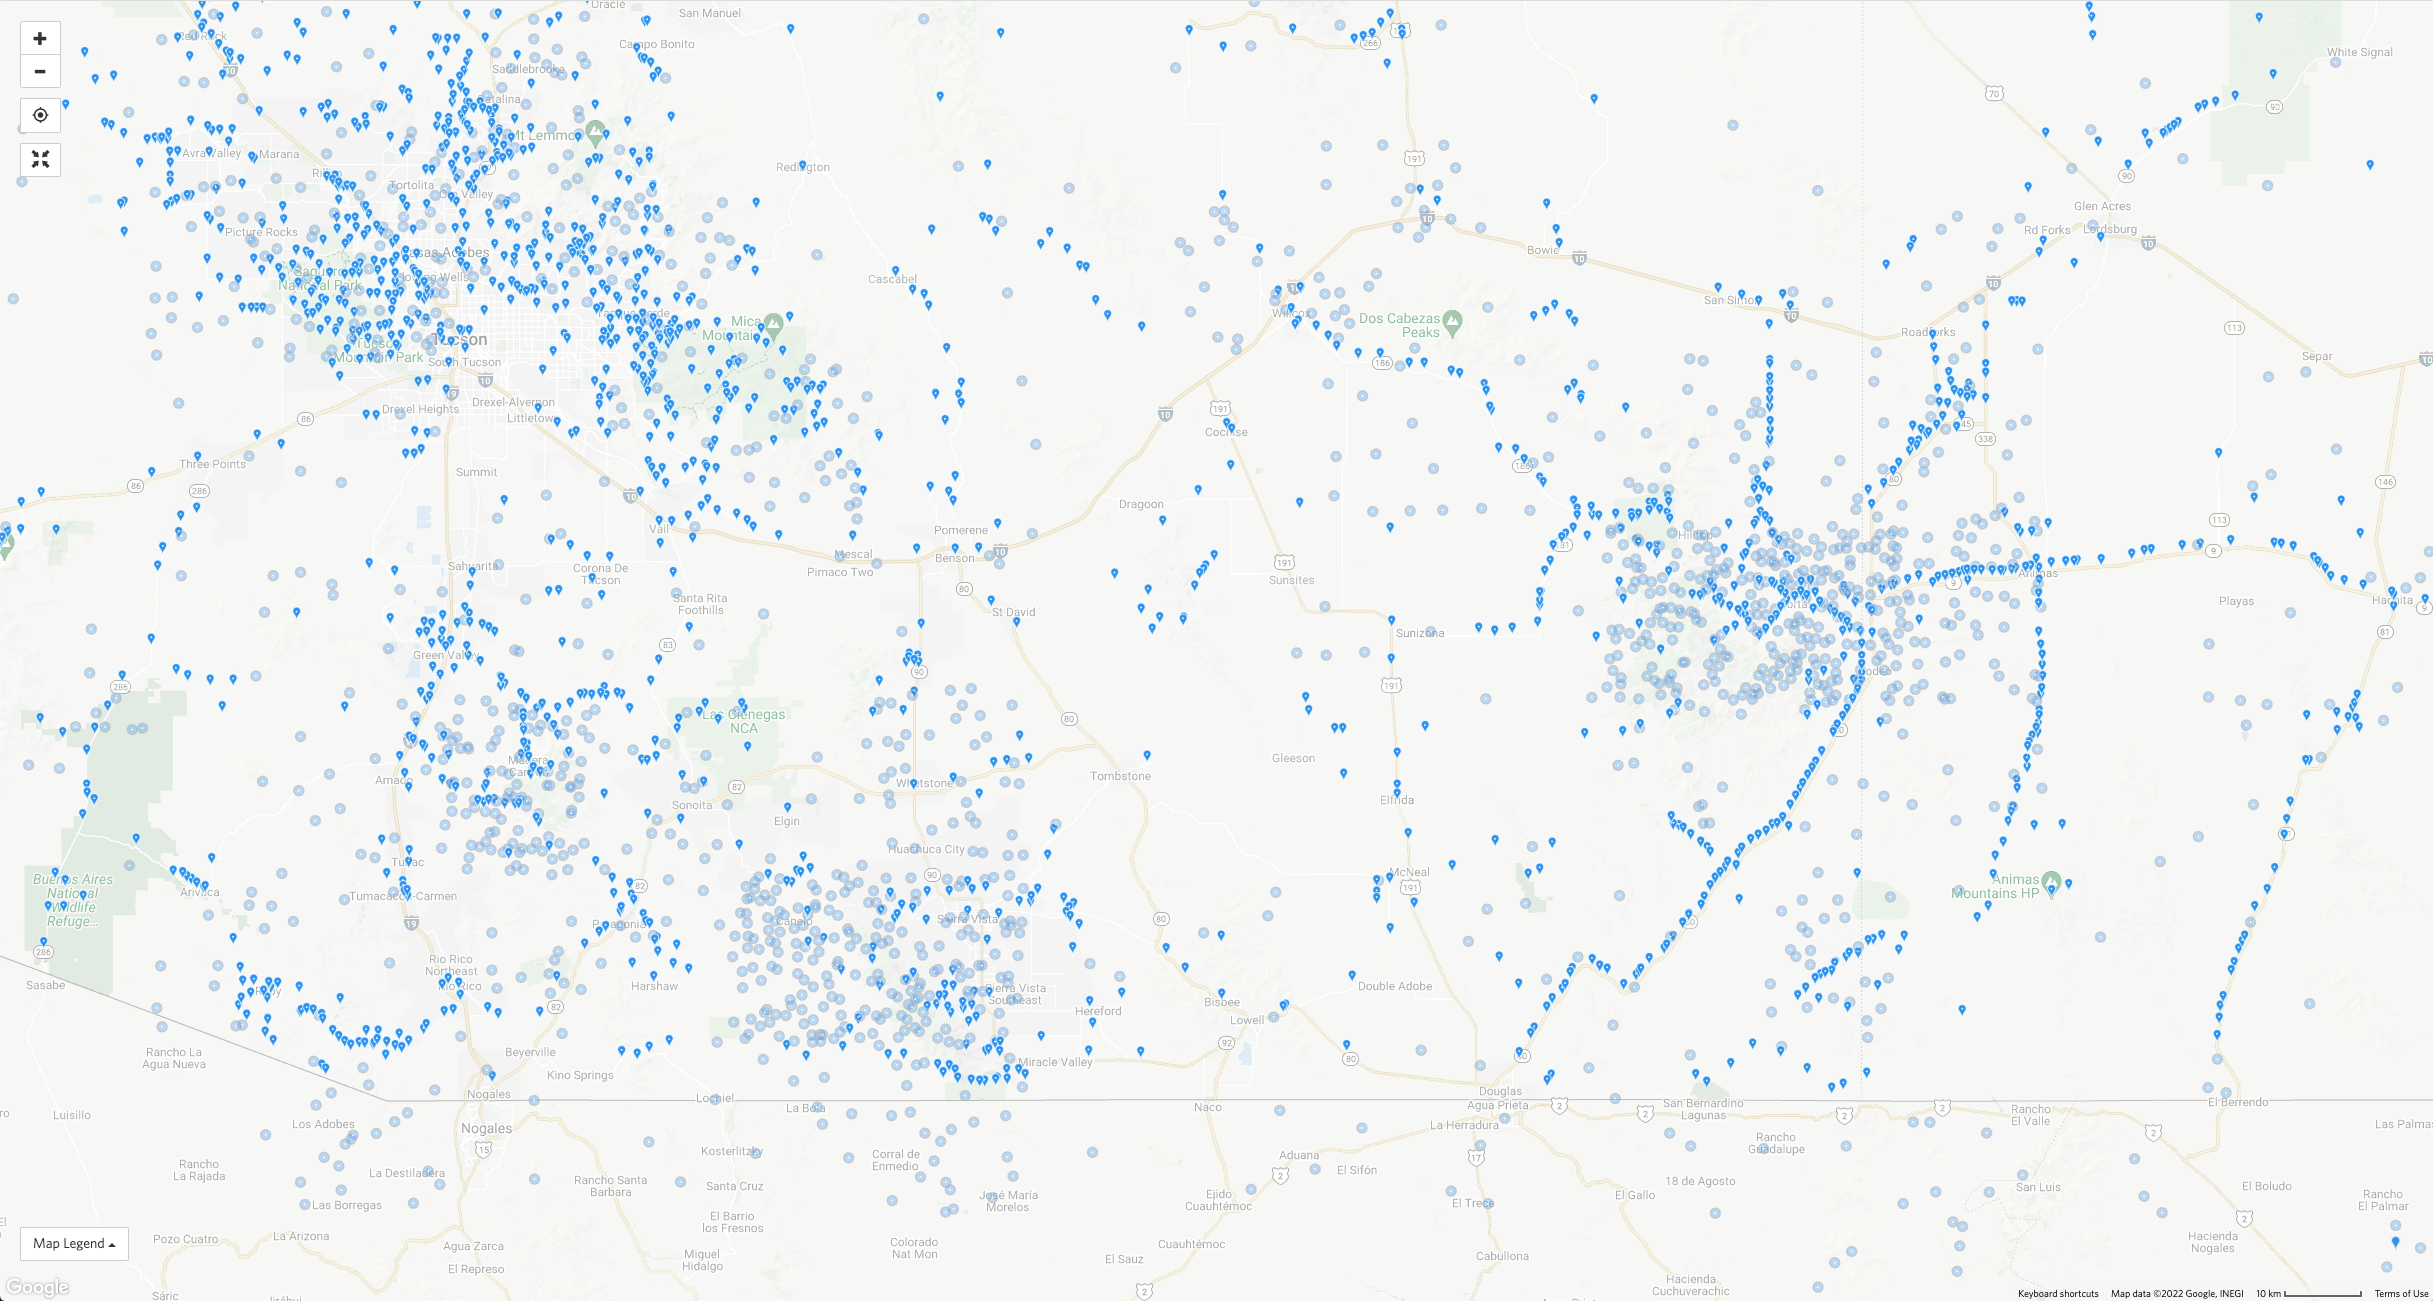
Access is crucial for making observations
Most land in the eastern US is privately-owned and so remains unavailable for most people to explore. Many parts of Texas and other states have large ranches that are off-limits for citizen scientists. Even if it is land managed by a government entity and publicly accessible, relatively few of us are willing to hike five miles to see a plant or animal that can be seen more easily elsewhere. Such is often the case on Bureau of Land Management or National Forest lands in the western US.
In many countries there are large areas set aside for nature reserves or parks, but these often lack road access. Expeditions must be mounted to visit such areas. And often the protection is on paper only – they are protected more by their remoteness. Without real enforcement of park boundaries, squatters invade along the peripheries of such parks. In such countries establishing road access to pristine areas without adequate protection usually leads to deforestation and expansion of agricultural and ranching activities. Such roads often don’t allow easy access to the pristine areas as the agriculture advances as rapidly as the roads. One can drive endlessly on such roads, looking for pristine habitat. This biases what a citizen scientist might see – towards species that are colonizers of disturbed habitats or species that can be seen from large “gaps” in the forest.
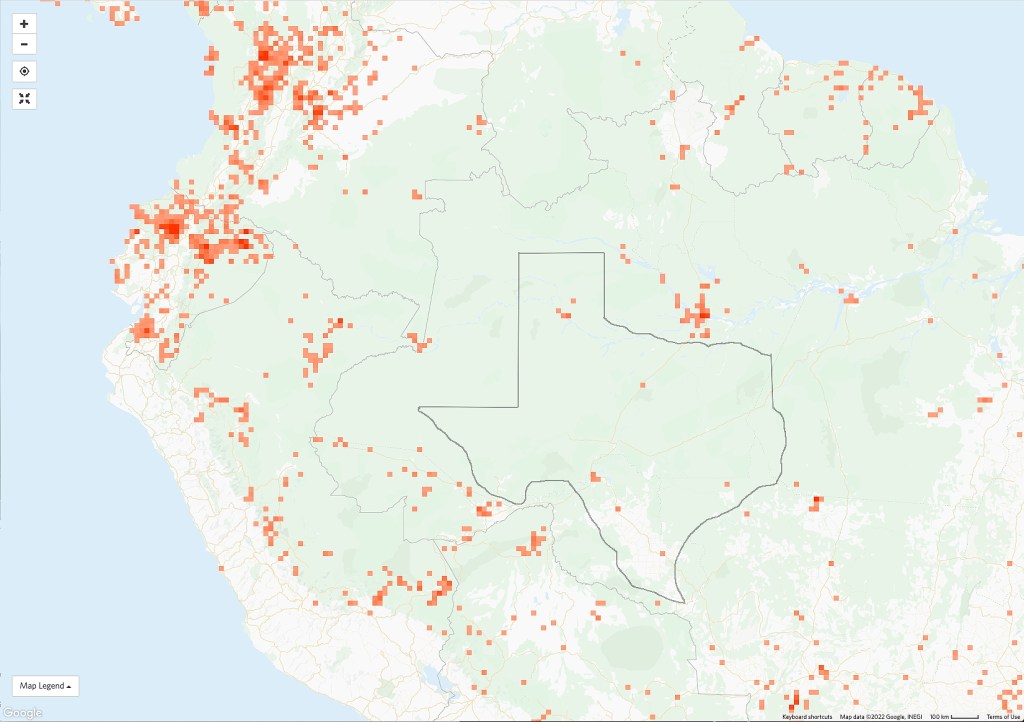
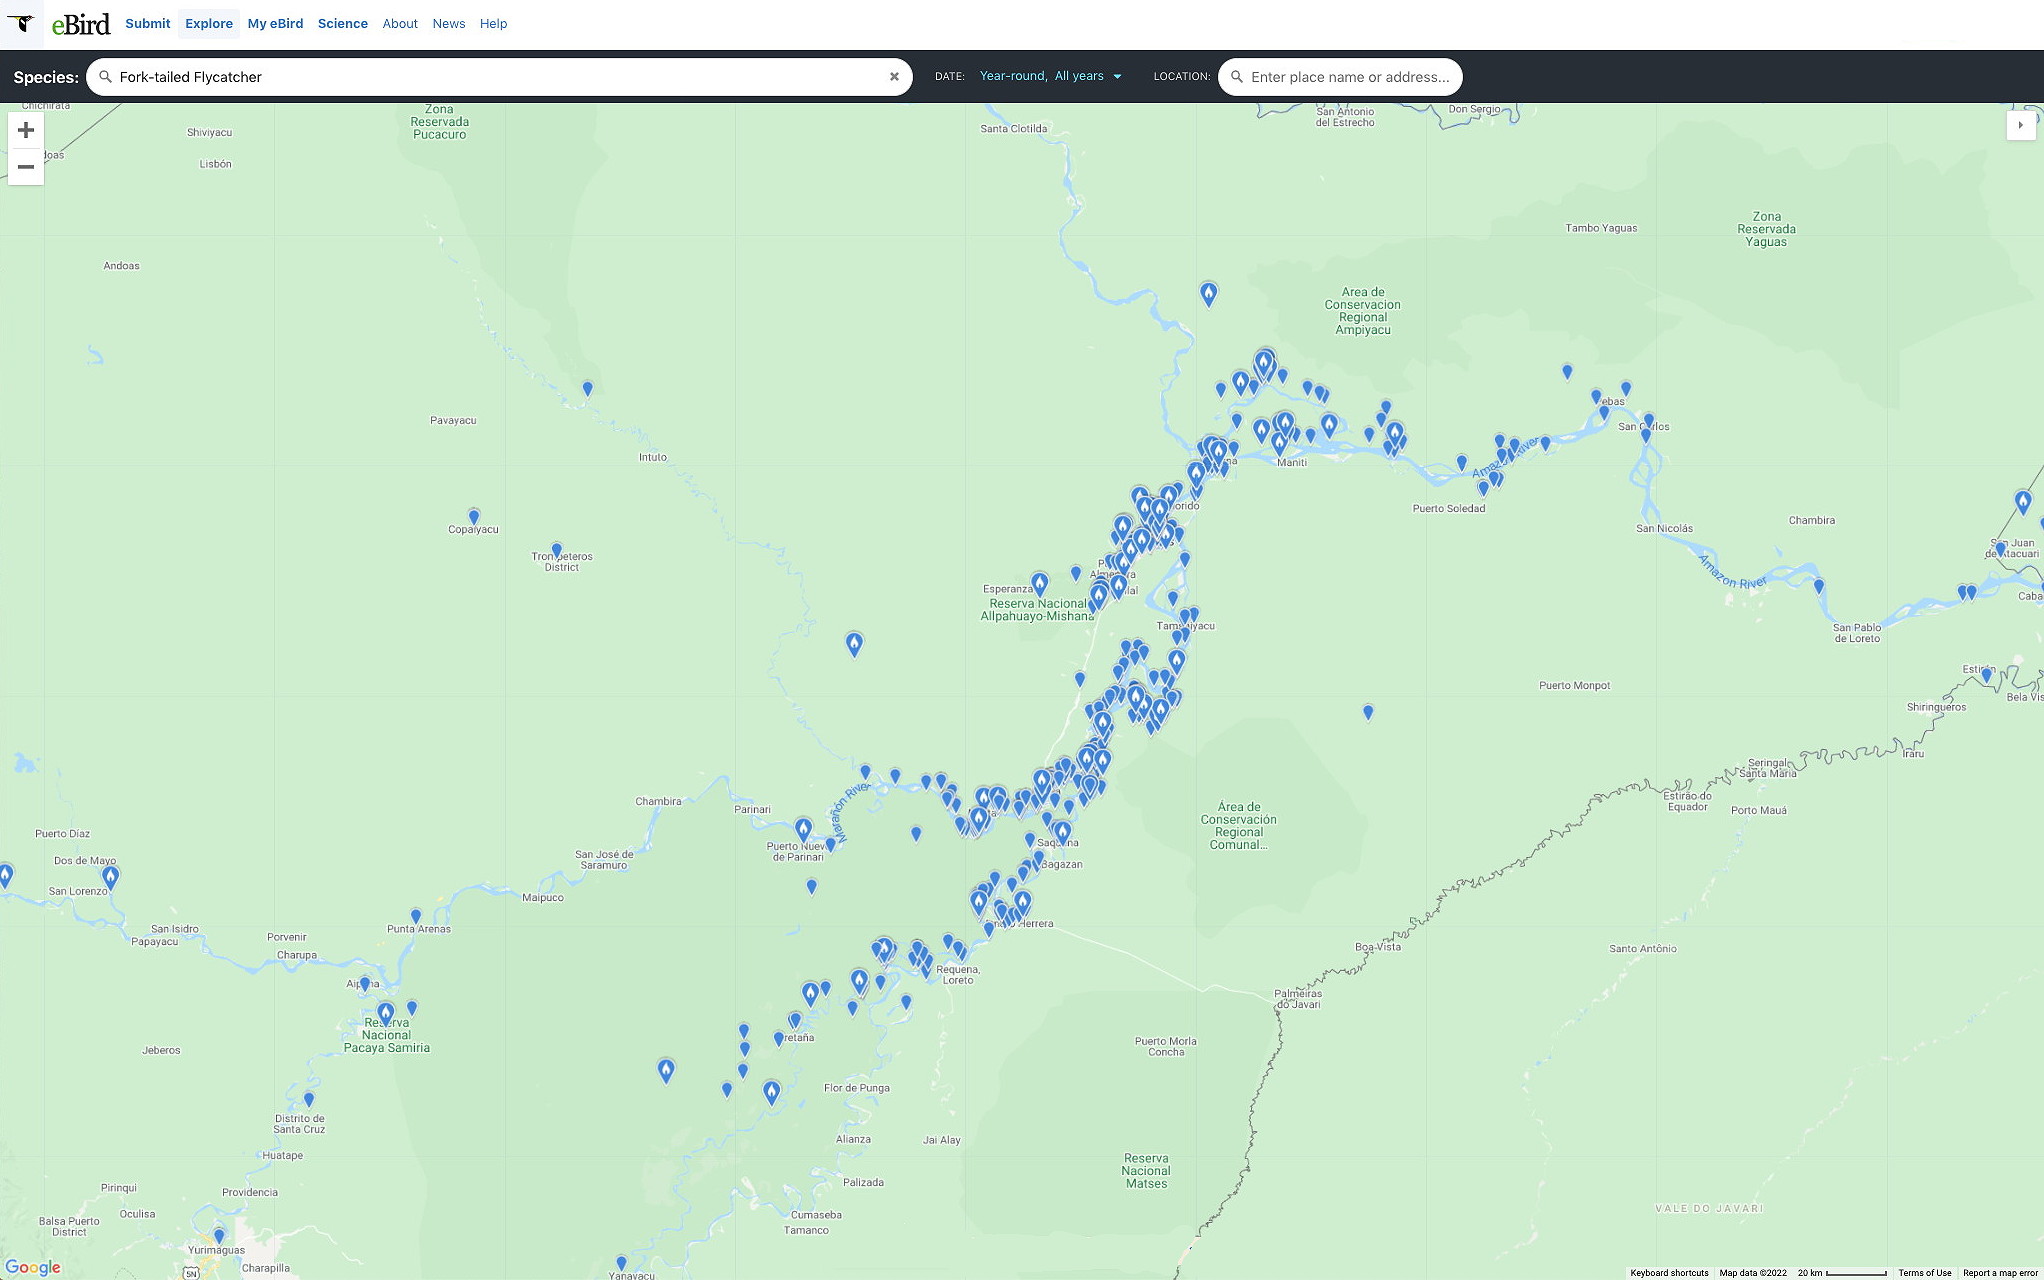
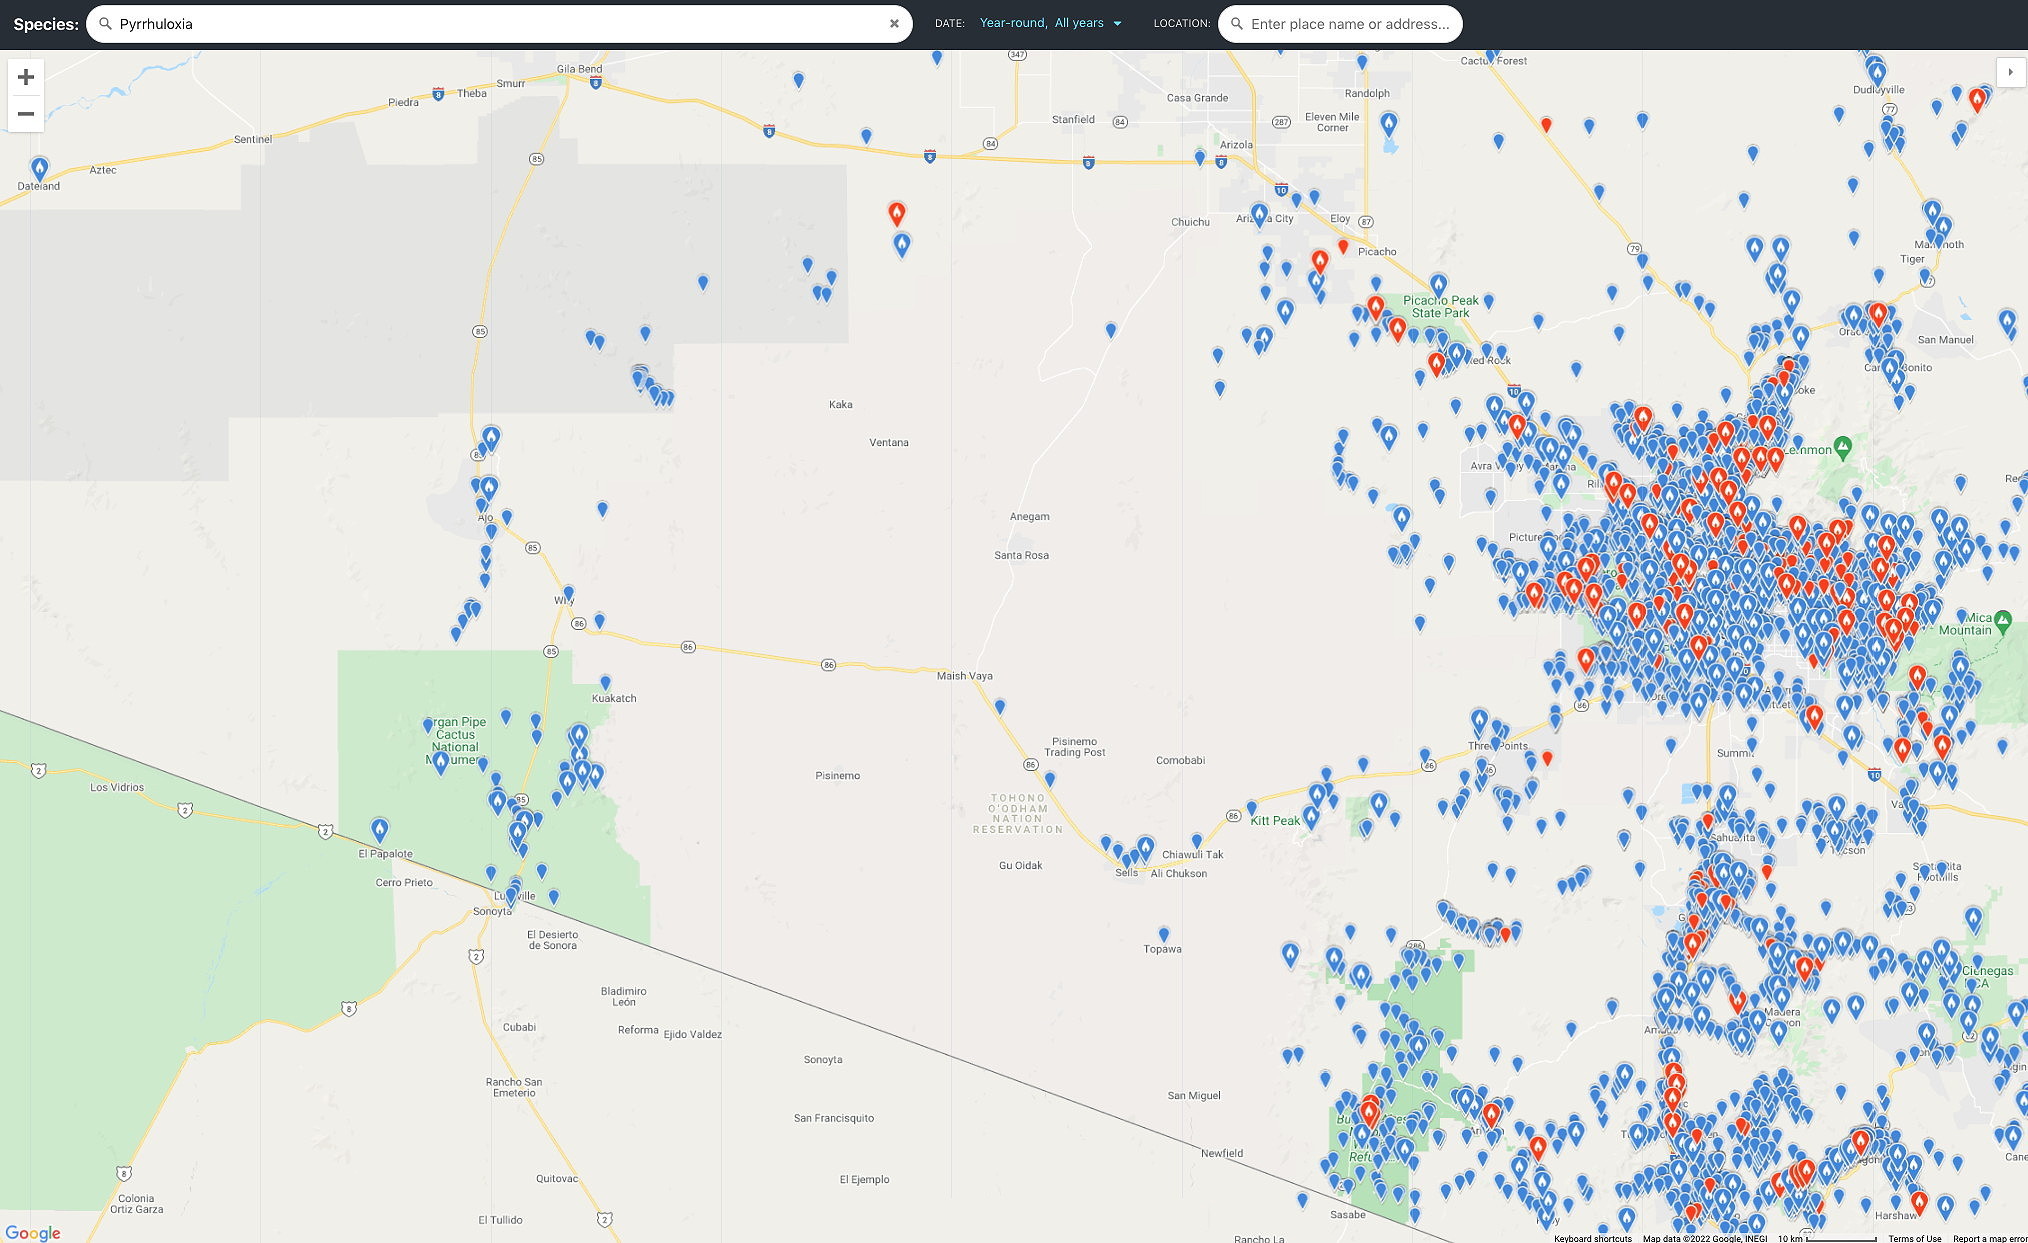
Although perhaps not obvious from the map above, rivers, being the main transportation route in many parts of the Amazon Basin, show a marked concentration of citizen scientist observations. A closer view below shows the Iquitos, Peru area and all eBird observations of a Fork-tailed Flycatcher (Tyrannus savana). It may be that this Flycatcher has a strong preference for riverine habitat – or that the observations reflect a strong sampling bias. We don’t know.
Seasonality affects observations
Citizen science observations can be strongly influenced by seasonality. Observations in polar regions during winter are few because of the lack of daylight and the cold temperatures. Similarly, relatively few people travel to desert regions during the hottest months of the year. In the tropics, many tourists avoid wet season travel because of the rain, higher humidity, and abundance of insects.

Most citizen science participants come from developed countries
Use of eBird or iNaturalist requires access to a smart phone or a personal computer. Though these are widely available in many urban parts of the world today, they are still less frequent in much of Africa and rural parts of developing countries than they are in the US or Europe. There may also be a language barrier, though iNaturalist has many regional nodes and translation is often available on personal computers.
Even if a person in a developing country participates in iNaturalist they may have difficulty traveling far from their home. The least expensive travel in much of the world is via bus, but this usually involves travel between population centers. Access to nature is more difficult without personal vehicles. Rental vehicles or taxis can be expensive for most people. And a reality is that people in developing countries with the financial means to travel are often not the members of society with the strongest interest in nature.

In some countries iNaturalist or eBird observations may be dominated by foreign tourists; such countries may show a strong seasonality for certain species when in fact there may be little. The frequency of observations may depend more on the vacation periods for tourists than the optimal time for observing nature in the destination country.
Some types of nature observations require specialized tools to be most effective
Although most common birds can be readily identified by “birders”, a few tools are essential to accurately identify many birds. A field guide, whether a book or an app on one’s smart phone, is a basic requirement for most birders. Hard-copy field guides are often unavailable in many developing countries because there is no widespread demand for them. And very few birders travel without binoculars. These are also not common among the residents of many countries.
A serious problem for birders with only a smart phone is that the photographic capability of these is quite limited. While they can be excellent for close-up photography and for landscapes, most don’t have sufficient telephoto capability for birds. Thus, unusual bird observations (especially range extensions or out-of-season observations) that might benefit from good photographs cannot be supported by smart phones. Although birders frequently travel with better cameras with telephoto lenses these tend to be expensive. In developing countries these are less frequent among locals and an observer with them may stand out.
Birders are perhaps the most common type of iNaturalist contributor that can benefit from specialized equipment. However, consider the situation with underwater observations. What is required to make iNaturalist observations underwater? An underwater-capable camera, the ability to swim well, and a face mask and snorkel are near-minimum requirements. For anything deeper than about 5-10 meters scuba gear is likely needed – along with its attendant expense and proficiency requirements. And a boat is needed to get to any location other than routine tourist diving locations. A small boat will get you a few miles from shore in calm weather but to get far away you will want a big (i.e., expensive) boat. In a nutshell, underwater citizen science observations are relatively rare.
Documenting smaller biota by citizen scientists and the need for suitable hardware
While many photographic cameras are adequate for showing enough details of larger organisms so they can be unambiguously identified, the diversity of organisms increases dramatically as their size diminishes. Insects are vastly more diverse than larger organisms such as reptiles or mammals. And the diversity of smaller insects is higher than the diversity of larger insects. Yet photographic documentation of smaller insects with enough detail for identification to species is difficult, and often impossible with phone cameras. How can the iNaturalist community address this challenge?
Some widely available hardware solutions to photograph smaller insects exist, though they are usually not inexpensive. A ring flash and a macro (close-focusing) lens are most commonly used for insect photography. This provides details of insects to only a few mm in size – though identification to species can be difficult or impossible without anatomical details that only a specimen can provide. This hardware currently costs from a few hundred to more than $1000 USD as well as requiring a suitable digital camera. Such an arrangement, though somewhat affordable to many individuals who make iNaturalist observations since they can afford smartphones, has drawbacks. Most non-phone digital cameras don’t have a convenient access to the internet, so instant gratification from a quick ID is not possible. Also most such digital cameras do not have GPS capability, so precise geolocation must be done some other way. Although this can be done by taking a photo with a smartphone at the same location, this is inconvenient, even for serious iNaturalist contributors.
One might hope that in the near future a camera manufacturer might produce a camera with macro capability, with GPS, and with internet connectivity built in. Some would argue that the latest smartphones already have this. In fact, smart phone cameras have greater depth-of-field, needed for macro photography. In our experience, they are not yet comparable with the mirrorless or DSLR cameras with macro lenses and dedicated flash set-ups. Smart phone cameras are constrained to be small, and rely on aspects of computational photography to make quality images for the demands of most users.
Assuming a cadre of sophisticated iNaturalist contributors with the photographic hardware for insect macro photography and experience with using it, how does one proceed to document what is out there? Although insects are almost everywhere, just hiking along a trail will reveal only the larger, more apparent insects. To find less obvious insects requires several techniques – some easy, others more tedious. A simple ultraviolet light arrangement with suitable sheets is commonly used for “moth-nights”. Most insects are much more sensitive to UV light and can be attracted to such lights.
Unfortunately, there are many insects are not attracted to UV lights. Those might be under logs, underground, or otherwise insensitive to such light. “Beating” shrubs can bring out certain insects, but this requires dedicated entomologists, not casual hikers. There will always be a trade-off between preparing individuals to document everything they might possibly come across while in the field and the need for most people to just have an idea of what they are looking at. Is having many more observers making observations of conspicuous and common biota better than much fewer observers documenting extensively what is out there? The answer is that both are needed. The nature-oriented individuals are needed to support conservation activities and the serious observers are needed to know better what is really out there.
Independent of the photographic capabilities of various cameras for documenting small biota like most insects, there is the fundamental limitation of photography to uniquely distinguish one species from another. Many species are cryptic and are distinguishable only by their sounds, time of year activity, or internal anatomy. Collected specimens are needed, but most people don’t want to collect, or don’t feel good about collecting live organisms. And in many countries, if not most, substantial paperwork is required to collect nearly anything. Perhaps AI identification will improve to a point where good photos are sufficient, but for now that isn’t enough for many organisms. And most observations today, and for the near future, will continue to be made by lower-quality phone cameras.
Assuming we have suitable hardware to produce excellent photographic images of most insects how do we get this equipment into the hands of people in the right locations worldwide to fill the gaps in iNaturalist observations?
Ways to improve citizen science sampling for spatial mapping of biodiversity
The current iNaturalist and eBird bias towards urban areas and nature preserves is good for describing temporal variations in the presence or absence of species at specific locations. For example, daily observations at backyard feeders, carried out in many yards across a large city, allows one to identify relationships between daily weather fluctuations and bird abundance or to see inter-annual variations in migration timing. If carried out over many years, subtle changes in migration patterns or bird abundances can be detected. The key is sampling frequently and over a large array of sites so that individual site biases can be accounted for.
Let’s consider some practical possibilities to improve the spatial mapping of biota. Where are iNaturalist or eBird observations needed? While every country has data voids, some are more important than others. A multi-pronged strategy to fill such voids might start with educational outreach to locals within the area/country. To start, this might require a website that shows the current observations, outlines key areas that are missing observations, and then suggests a strategy to increase observations there. Identify groups of people willing to jointly survey the area (safety in numbers and some specialists to help). Suggest positive reinforcements for helpers – inexpensive, but visible, rewards for helping. Identify areas where a short, intensive campaign by locals could make an initial survey. Ideally with a one-day effort. This is impractical for remote locations and most islands but might be feasible for mountainous areas near population centers.
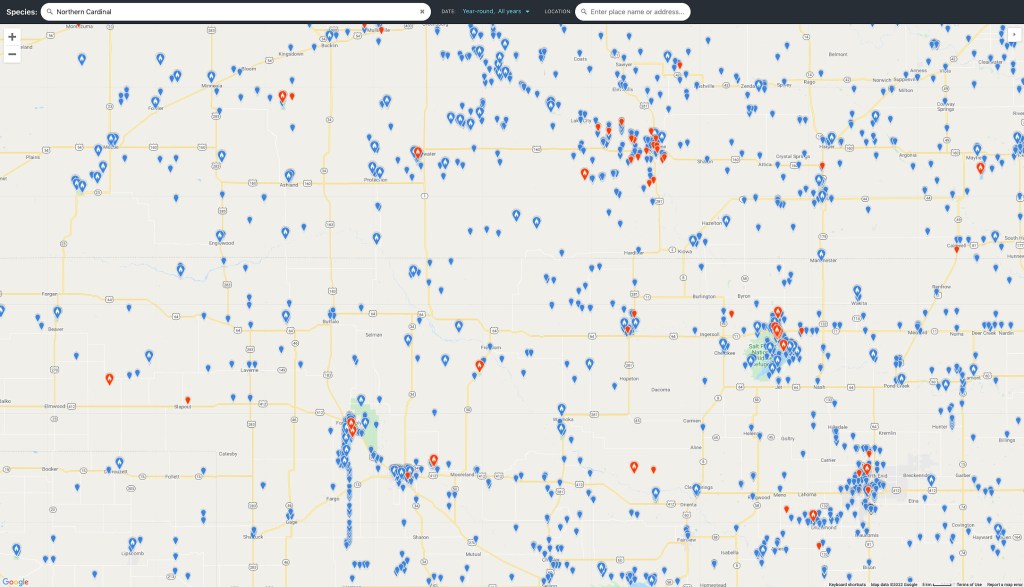
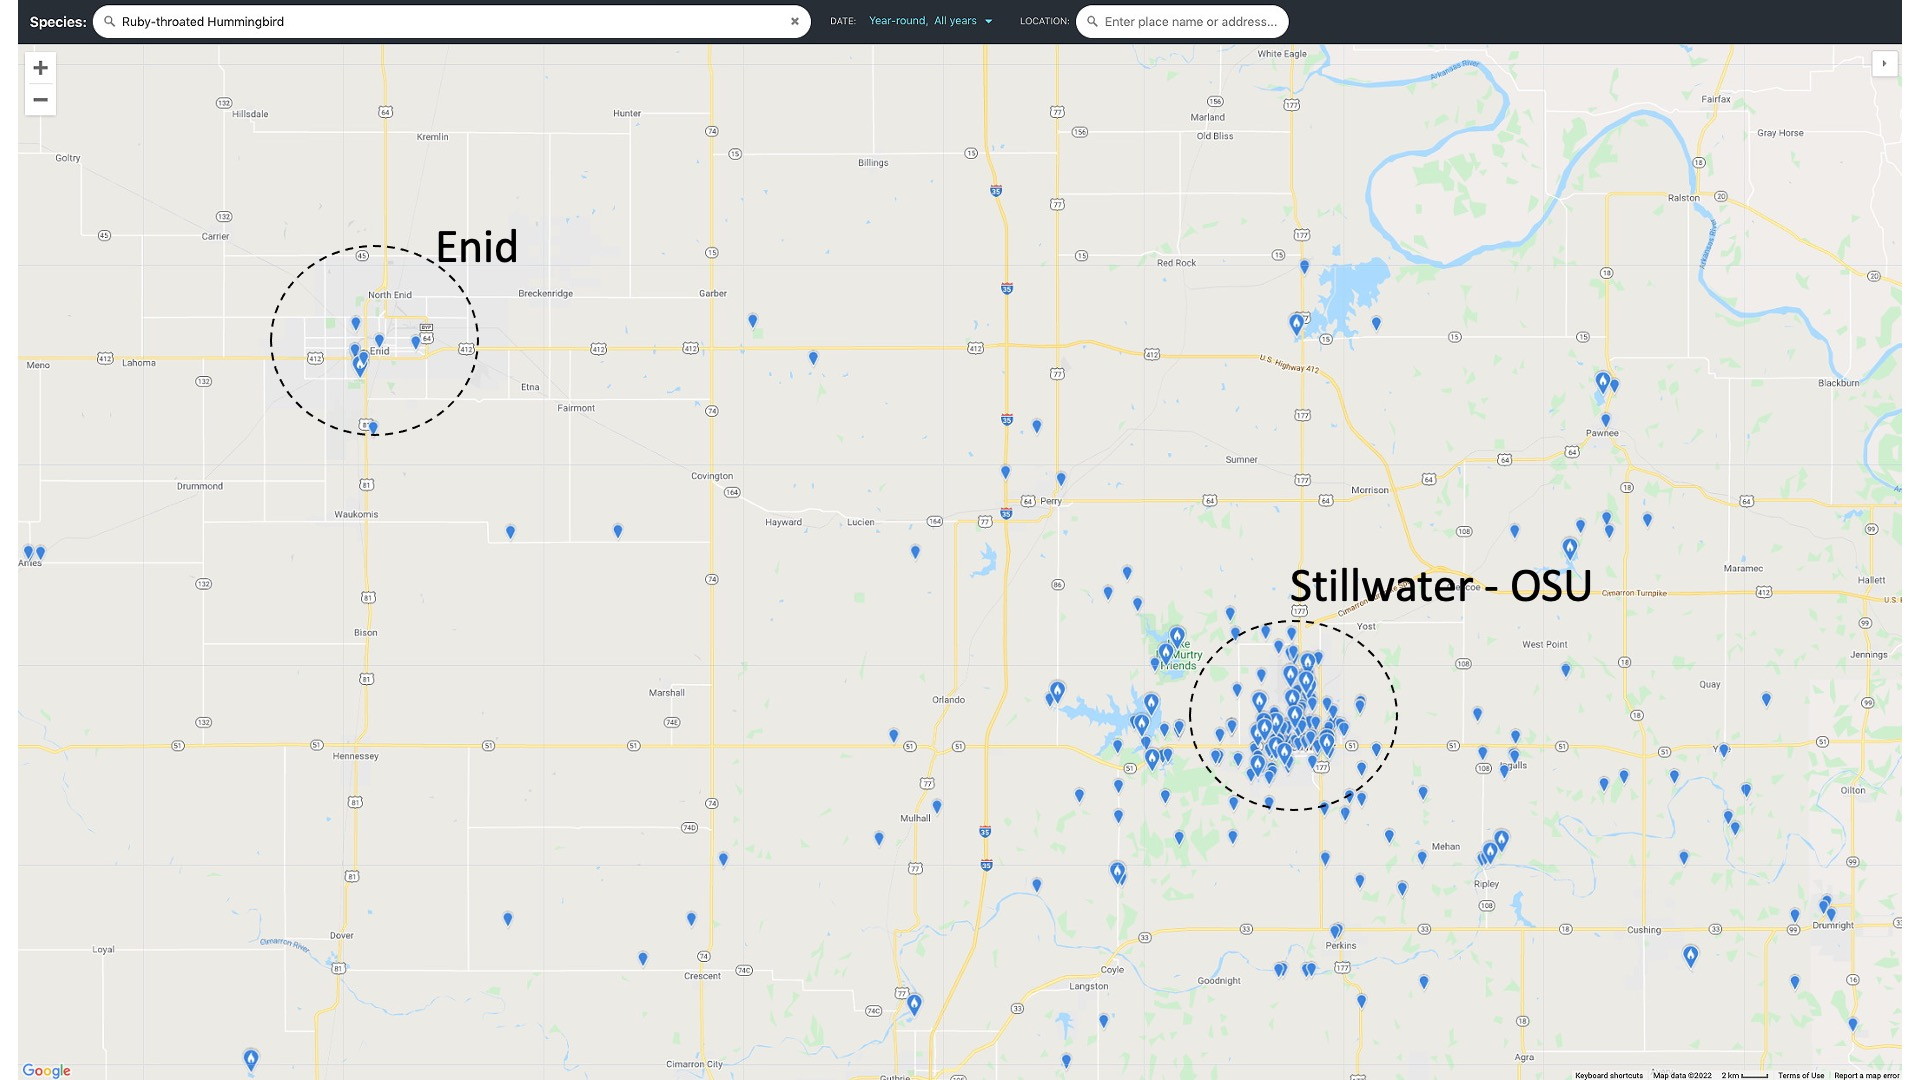
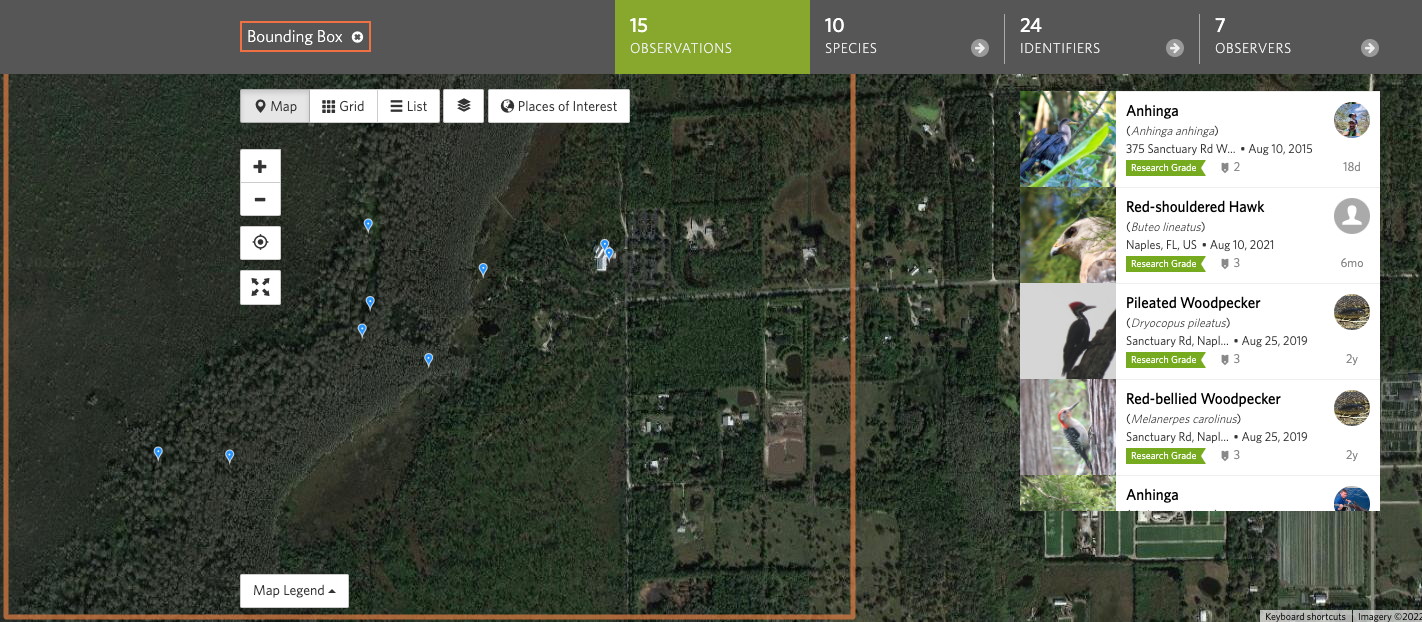
A major issue with citizen science observations is that less conspicuous biota are not as readily observed as more obvious ones. For example, the most commonly observed lichen species in Oklahoma (Common Green Shield) has 89 observations on iNaturalist, whereas the Northern Cardinal has 1207 observations. The westernmost county in Oklahoma, Cimarron County, has 40 observations of “common lichens”. Most of these observations were made on one day – by one observer! Fewer people have a knowledge of lichens and are not trained to see their diversity as readily as recognizing different bird species. Many, if not most biota have few citizen science observations because many people don’t have an interest in making observations of them, don’t appreciate the diversity of the group, or are unaware of the need for such observations.
How to stimulate interest in citizen science observations?
To stimulate further interest in citizen science observations at the international level it will be useful to identify key contacts in different countries. In principle this is straightforward with iNaturalist because the observers are listed by number of observations they have made. One could select some of the more productive observers from each country and send them messages via iNaturalist asking what are the most serious issues limiting citizen science observations in their countries. To complement this, iNaturalist observation maps can be generated for each country and the data voids (by major taxa) depicted. These areas can then be publicized so that local observers can focus on the areas to help fill observation gaps.
Identifying the data gaps by taxa is crucial. There may be sufficient bird observations, but too few observations of fungi, insects, plants, or other important groups. There should be frequent feedback between scientists and local observers to motivate the expansion of observations, both spatially and taxonomically.
Crucial to expanding citizen science observations would be Zoom-type short courses on how to use eBird and iNaturalist. Although explanatory material is available online from the very thorough eBird and iNaturalist websites, some material may be difficult to find. Talks, whether live or virtual, can often be more effective in motivating observers. Downloadable posters may be useful to help to stimulate people who cannot attend Zoom sessions. These could be posted in schools or universities in any country.
Citizen science efforts aren’t only about generating more observations for scientists. In fact, this objective probably isn’t even the most important aspect of the effort. It is primarily about generating interest among the public in nature and science.

Misleading impressions from citizen science data
There can be misleading impressions derived from basic iNaturalist statistics. For example, there are 442 species of amphibians identified on iNaturalist from Colombia, making it among the most diverse country in the World for such fauna. But examining the statistics for individual species one sees that about 260 species, or 59% have 5 or fewer observations and 117 species (26%) have only one observation.
The example of Colombia is not an anomaly – virtually every country shows similar statistics, with a few species dominating the observations and most species having very few observations. Although more (good) observations are always better than fewer ones, citizen scientist observers can benefit from knowing which species need additional observations and which ones are already well-sampled.
Example of a strategy to improve iNaturalist observations
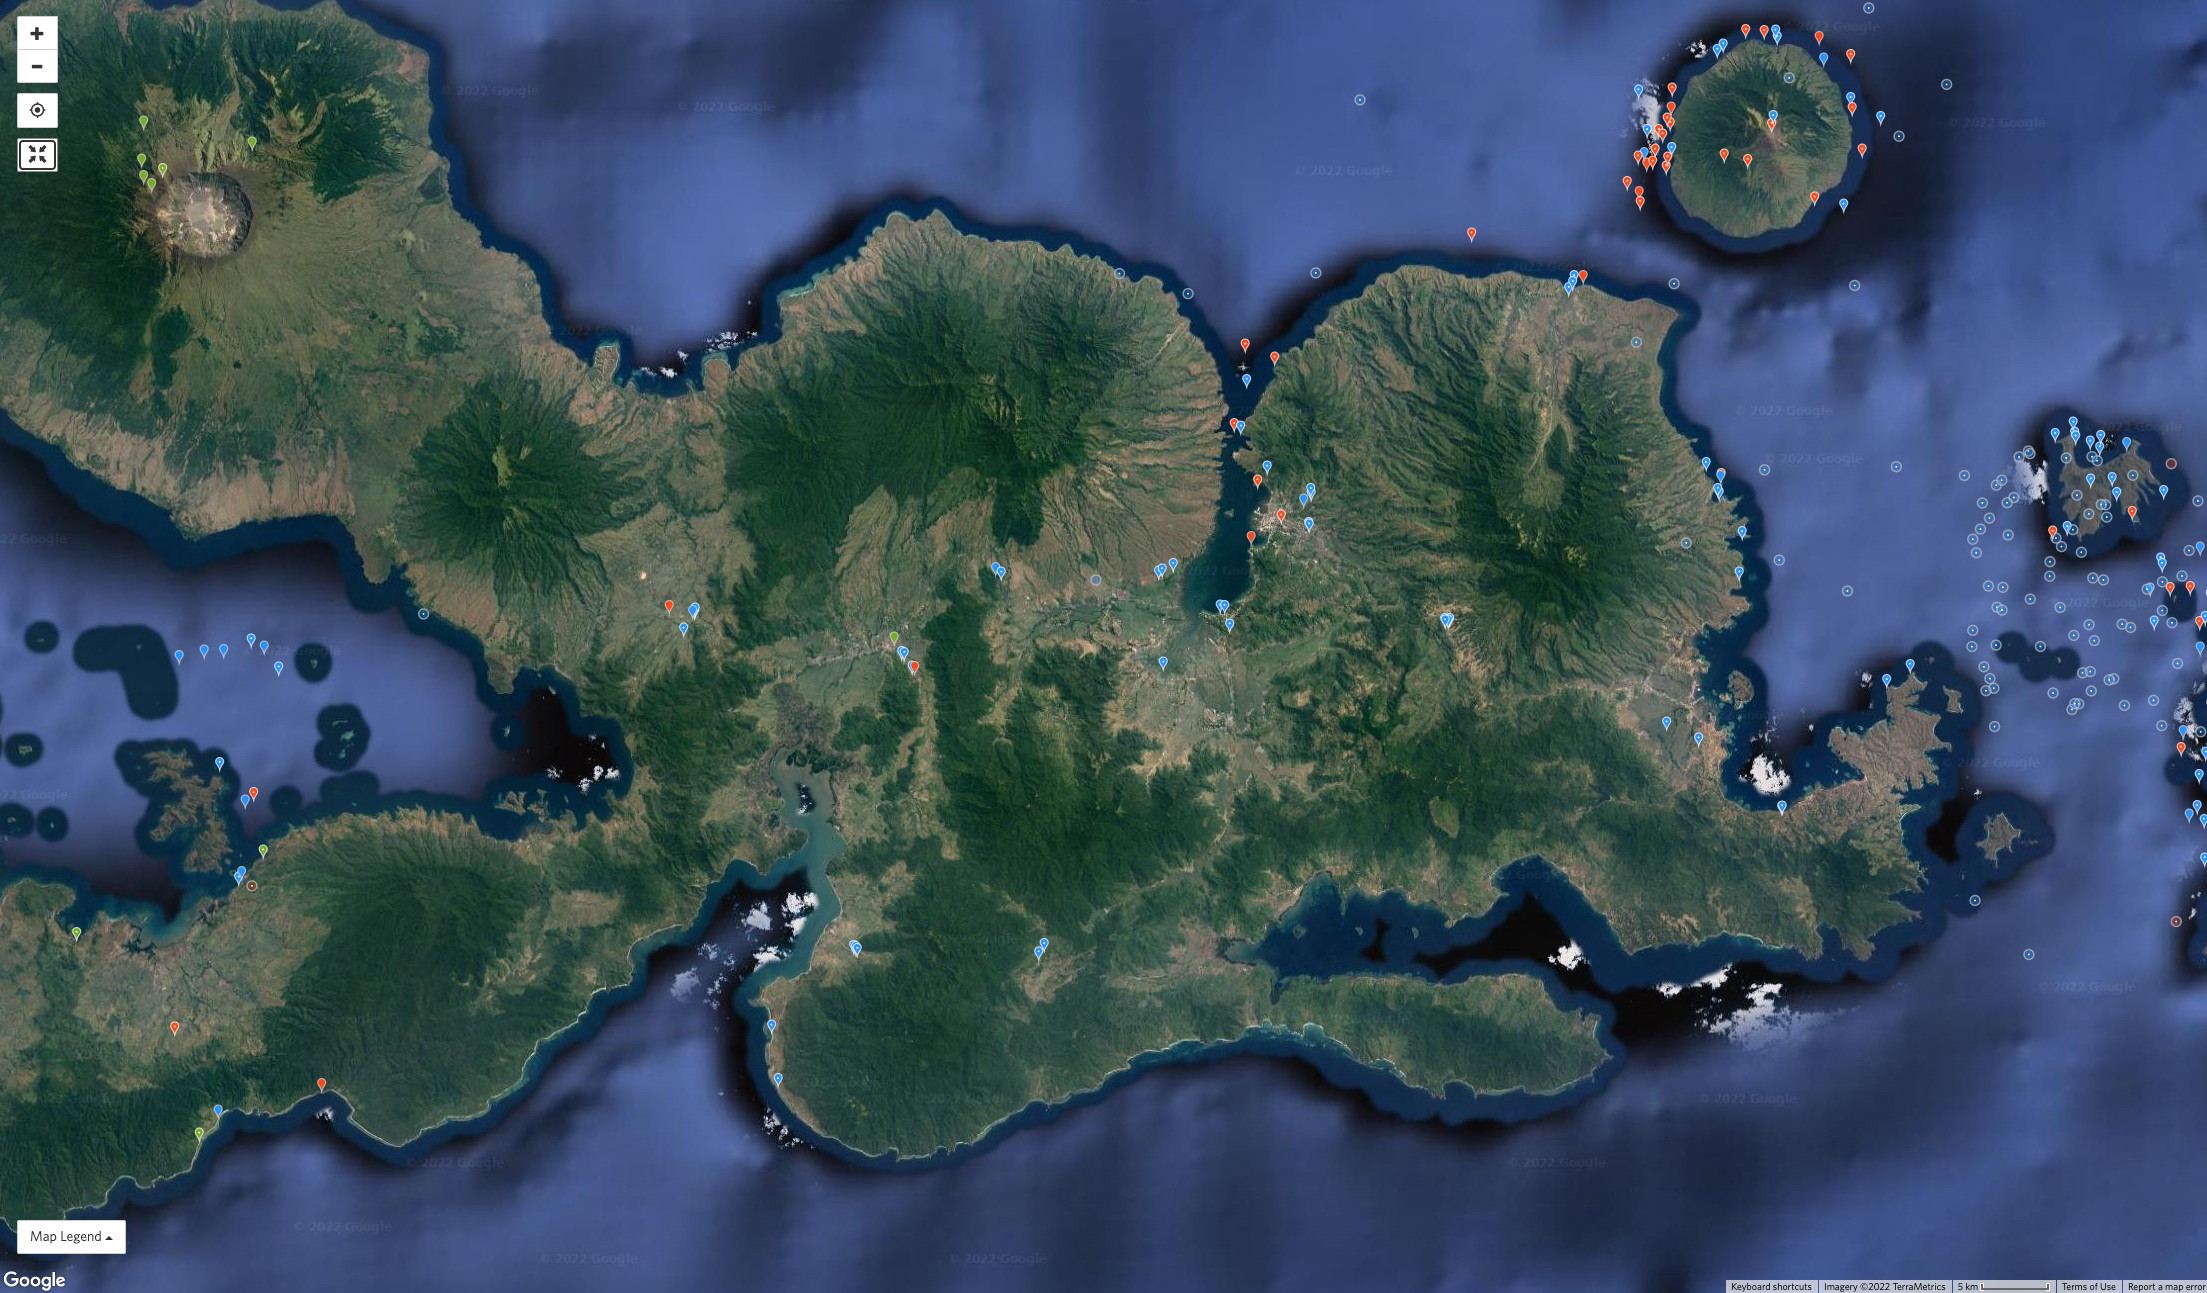
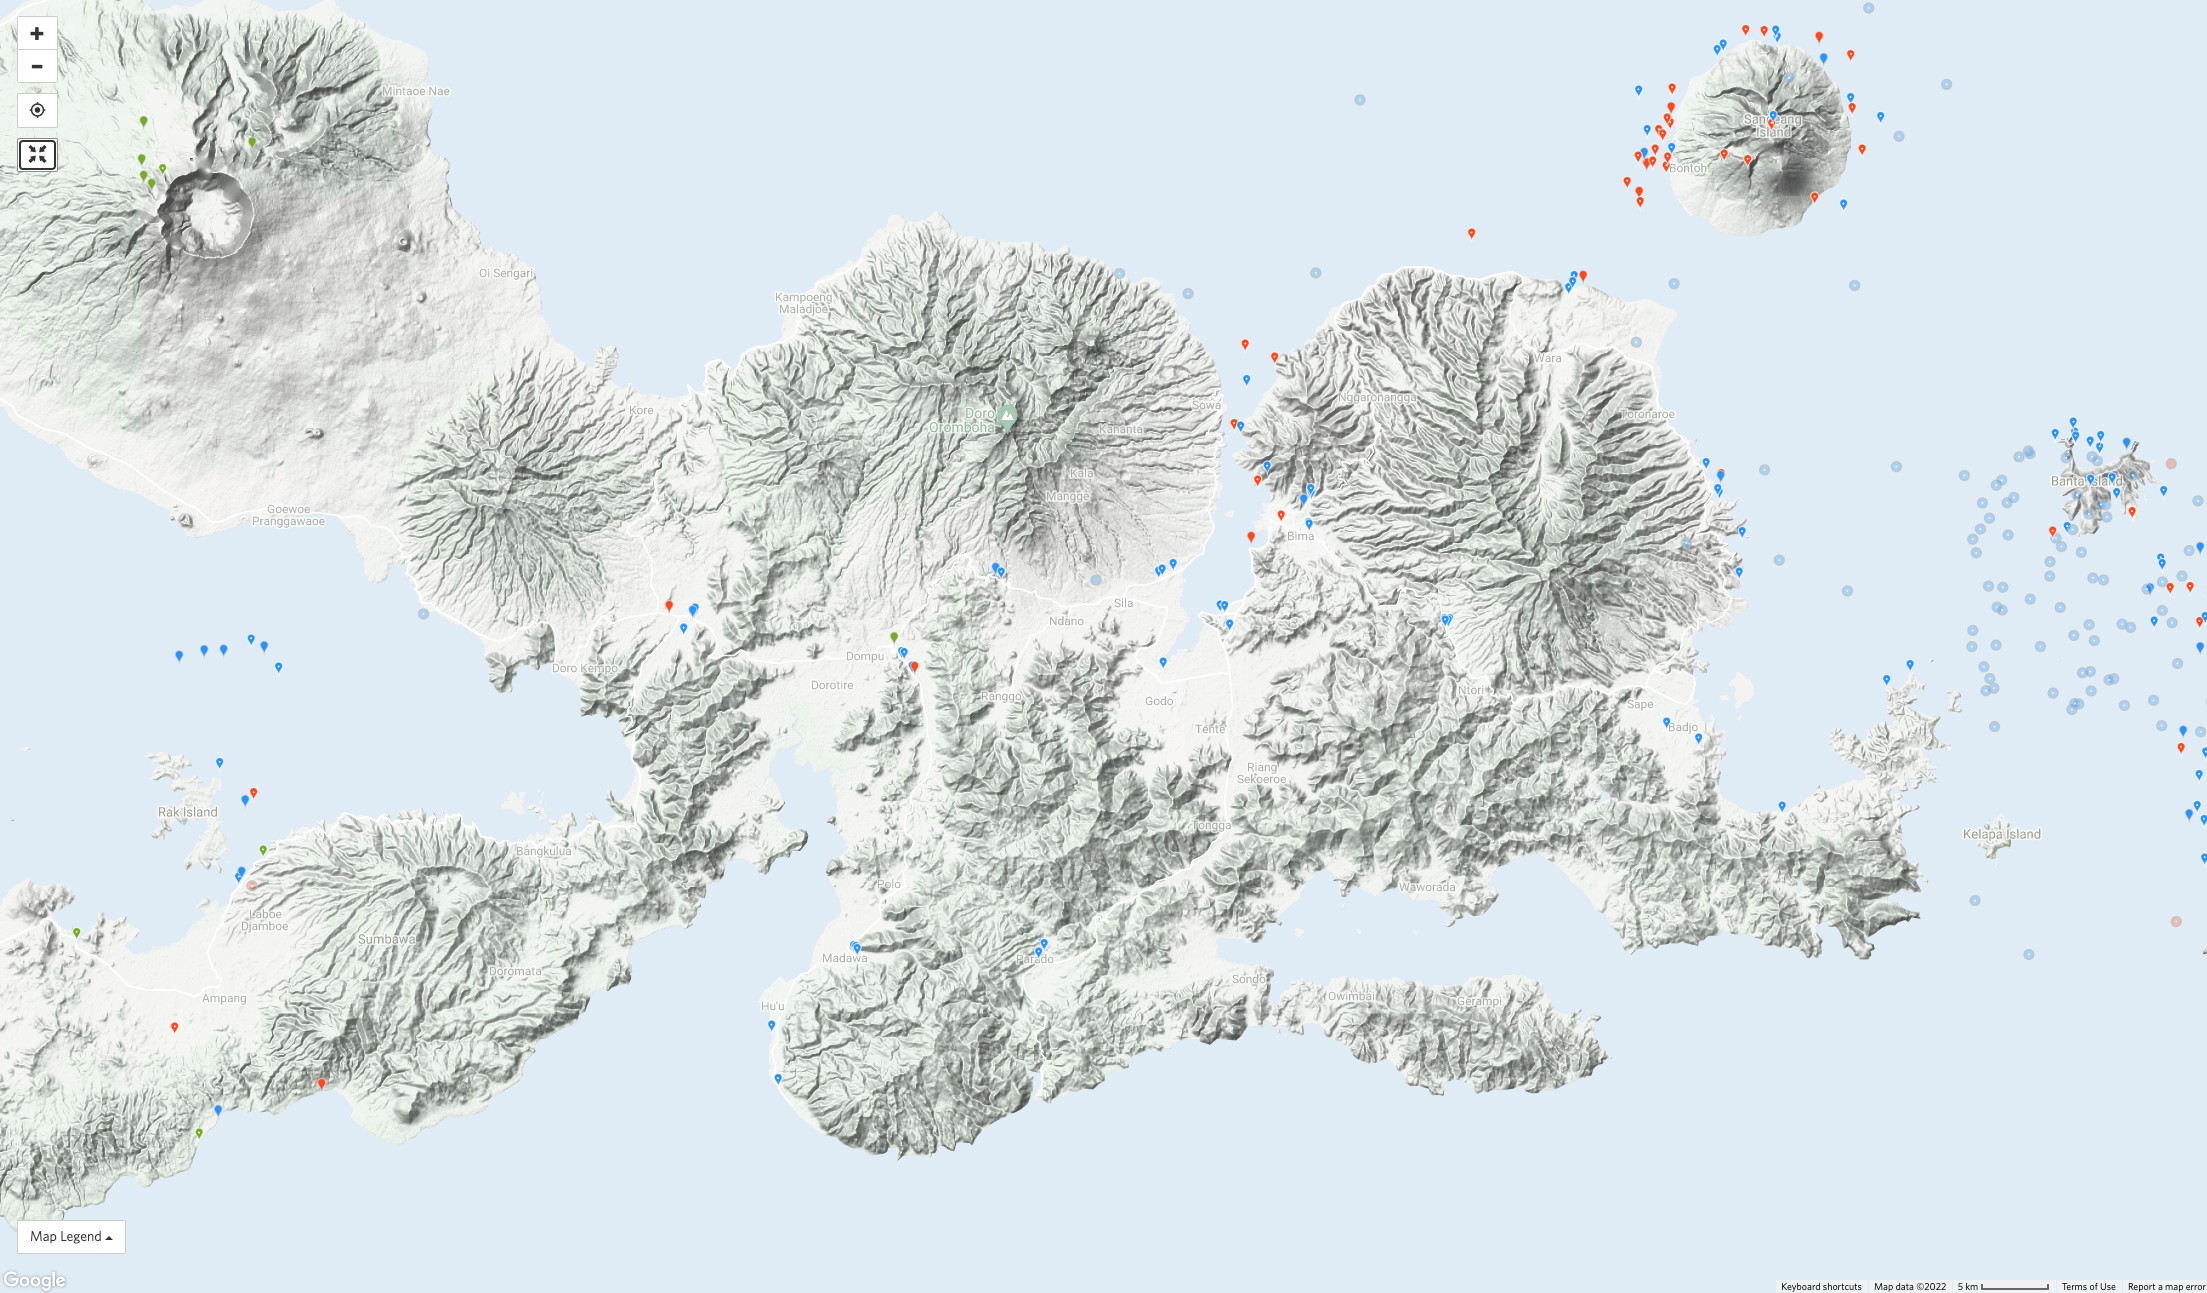
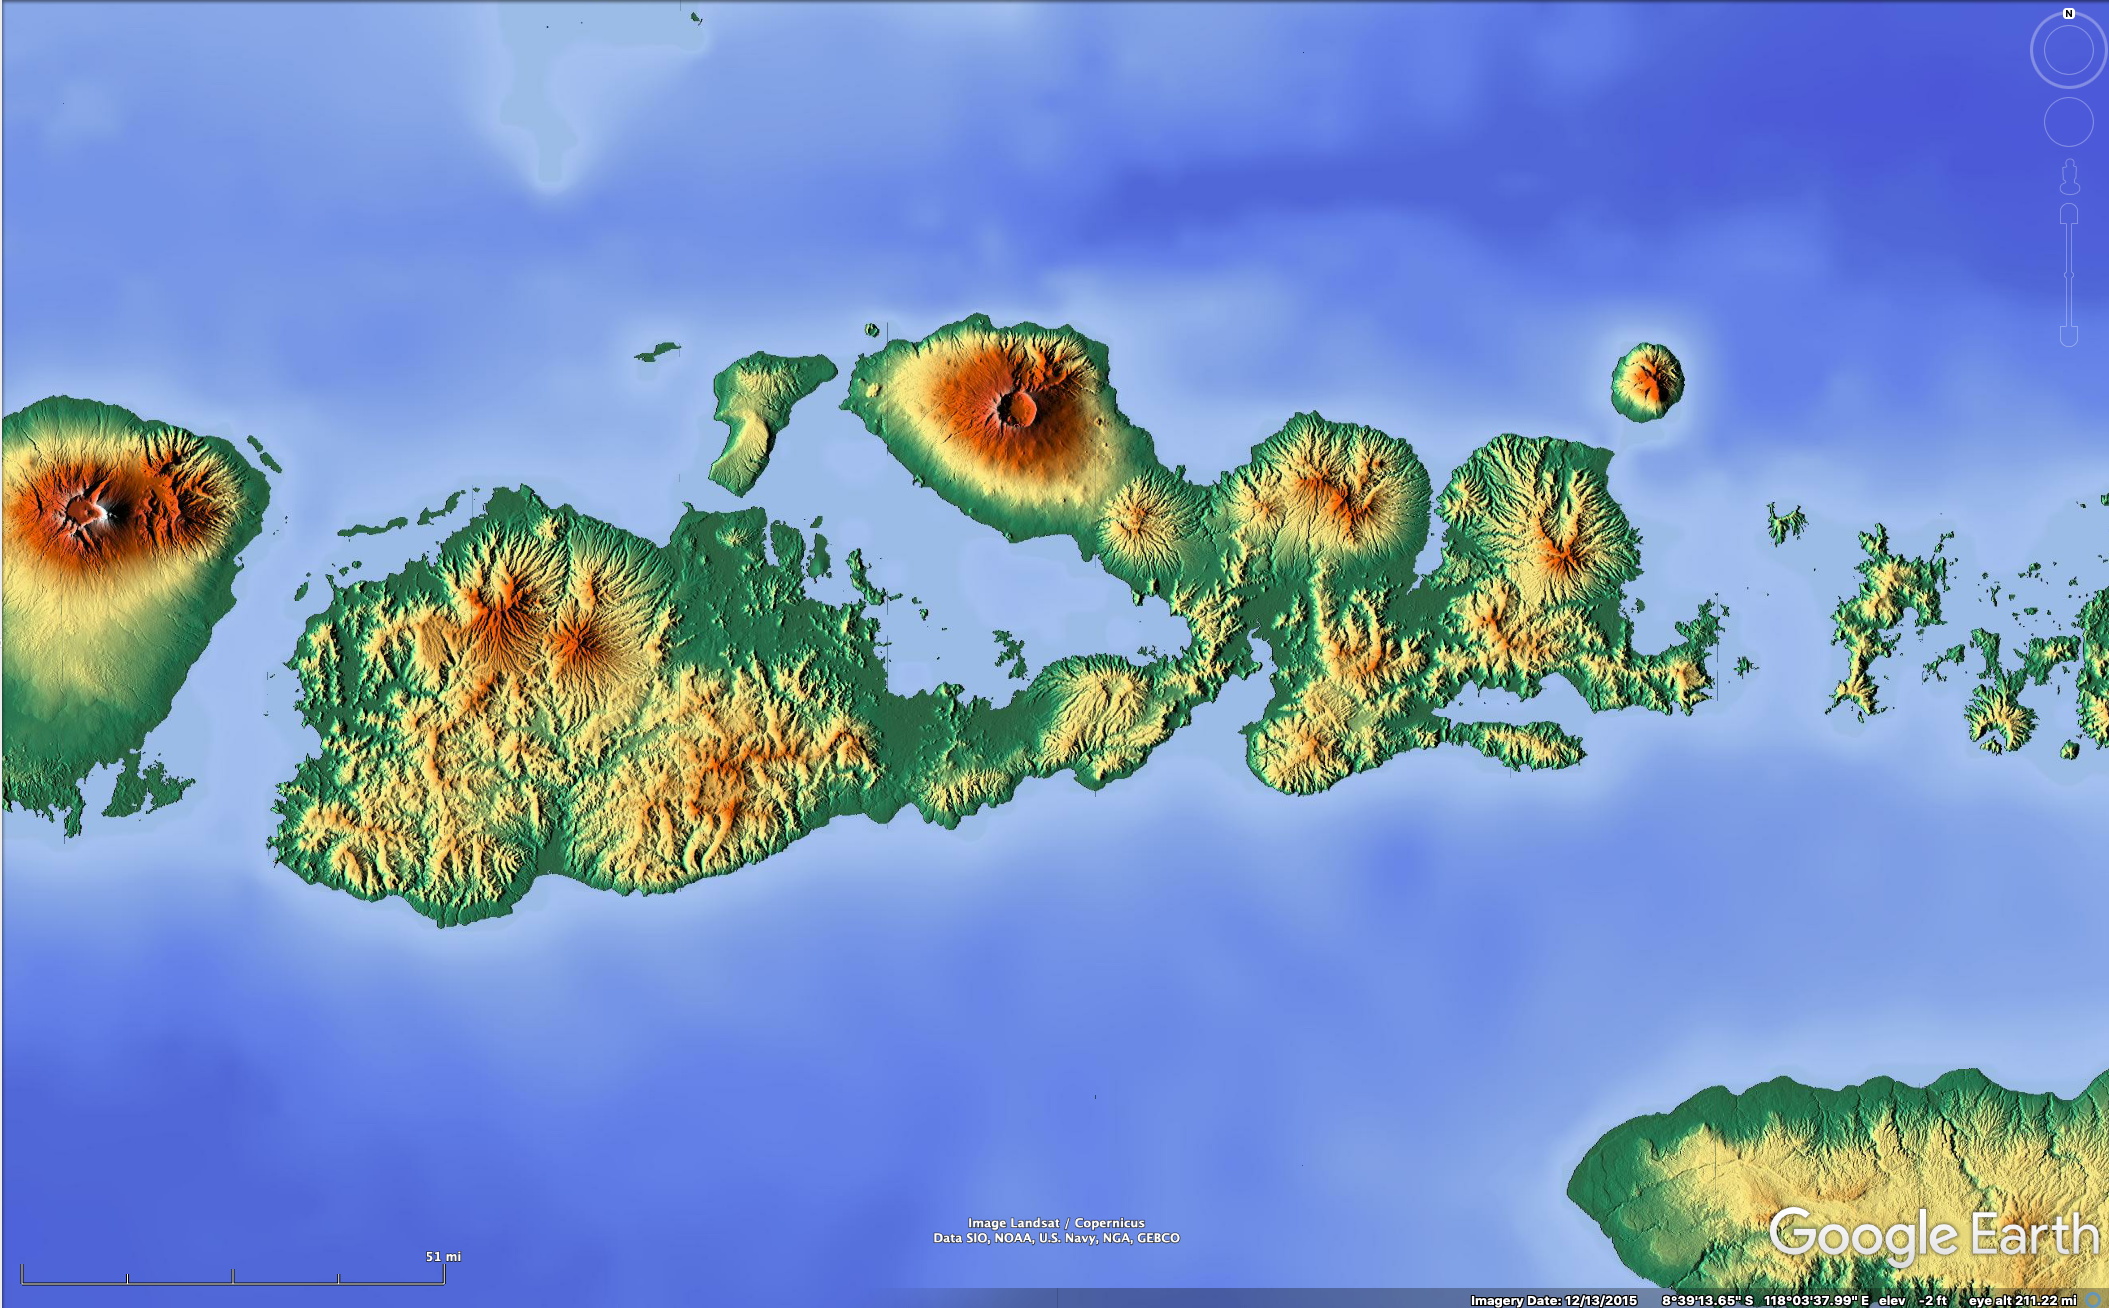
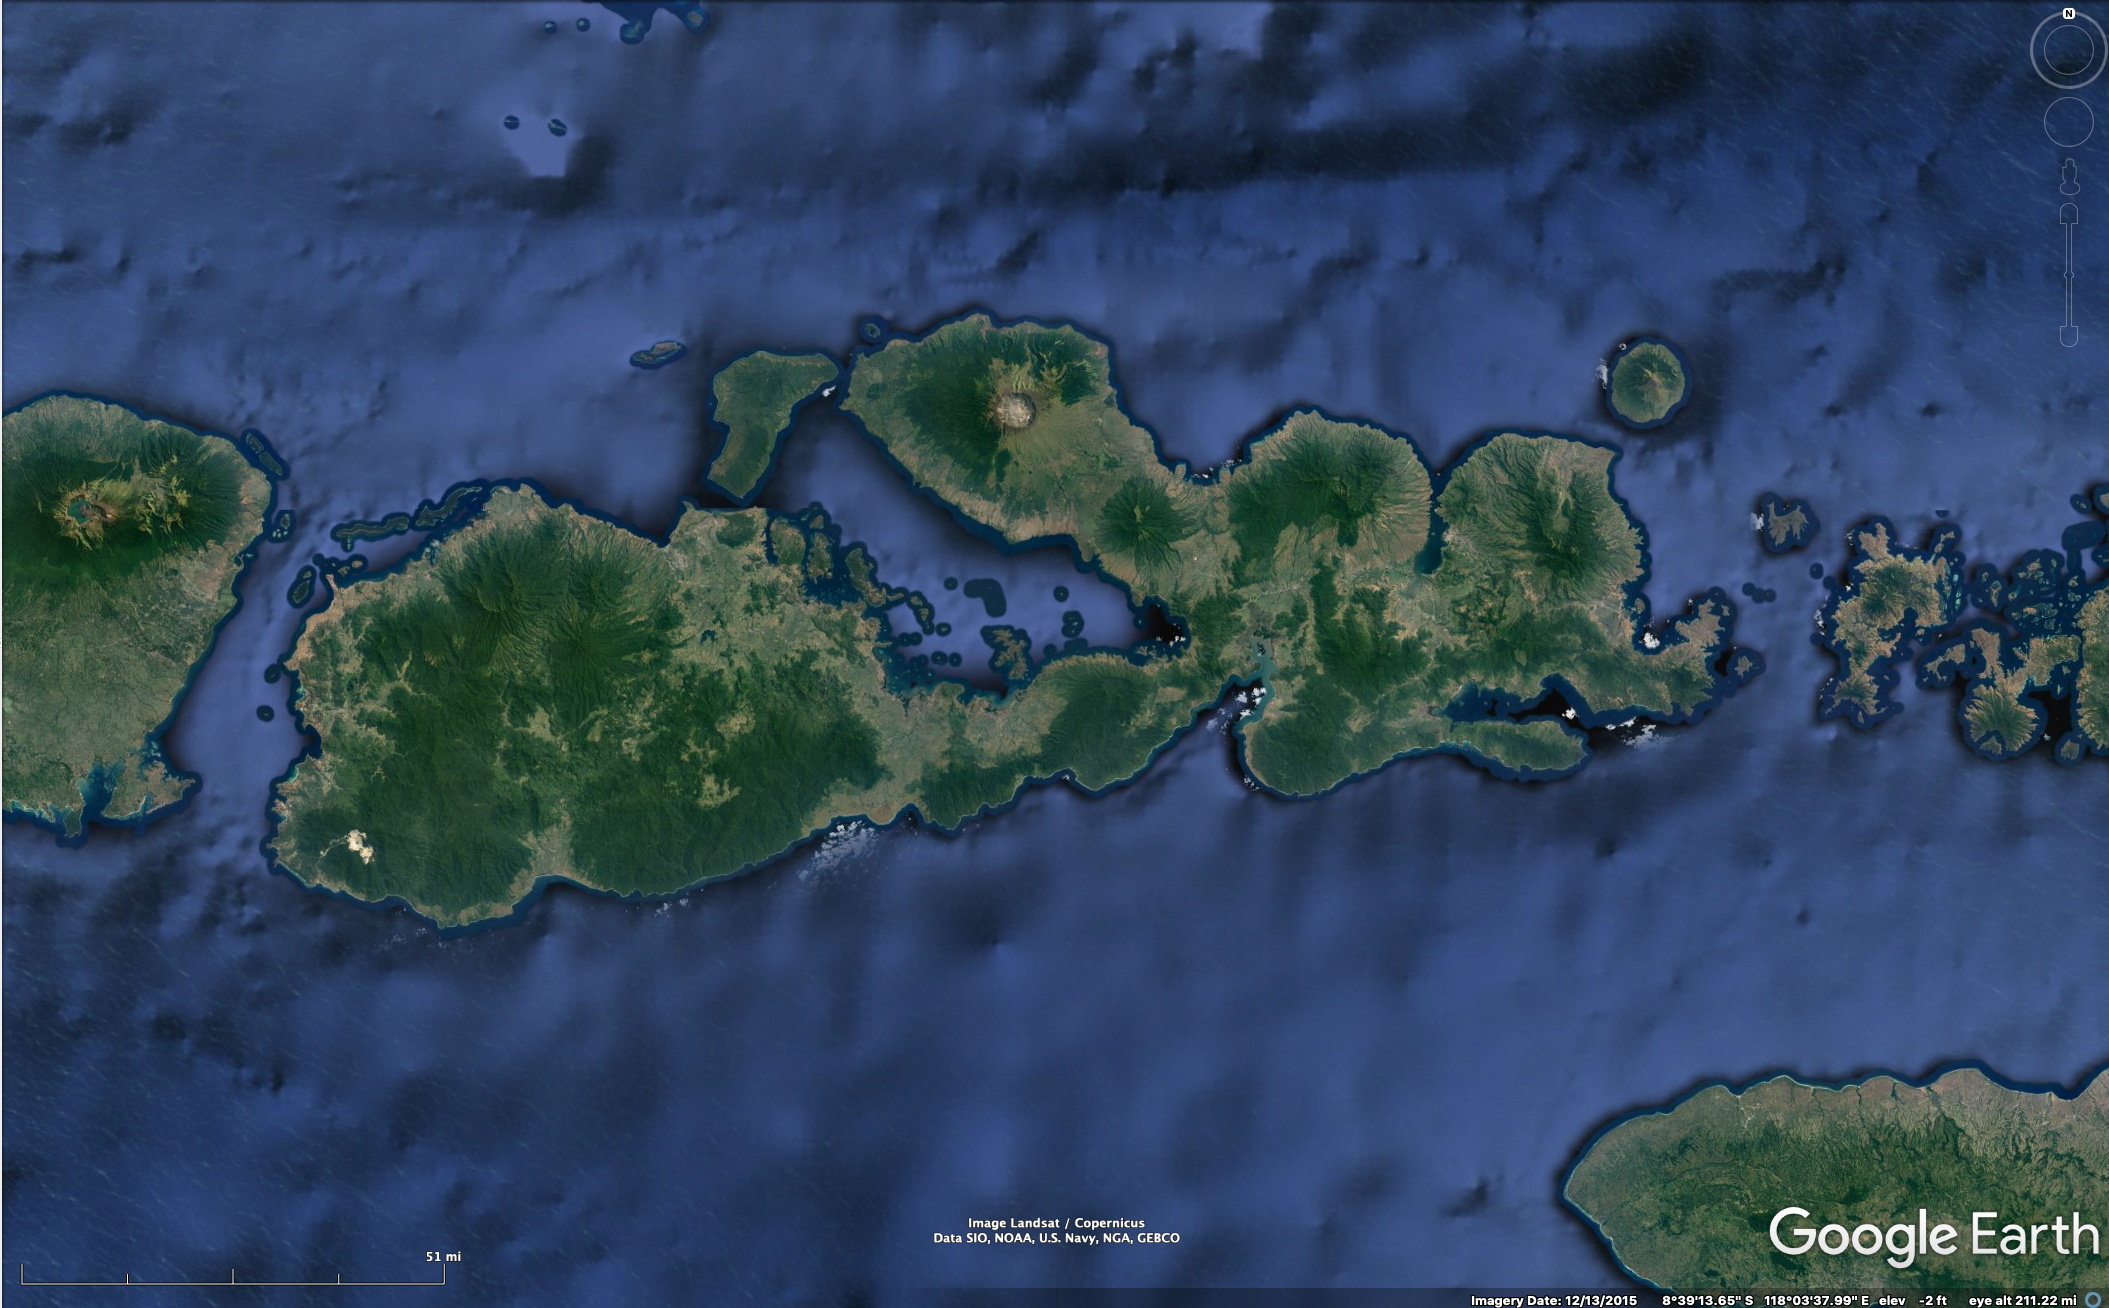
Here we consider an example of how one might proceed to improve iNaturalist observations in a biodiverse region where such observations are seriously lacking. We consider the island of Sumbawa, Indonesia. This island is large – about 265 km (165 mi) in east-west extent and with more than 10 volcanic mountains in various stages of erosion. These mountains are separated by low-altitude areas of seasonal dry forests, now mostly replaced by agriculture. In contrast, the volcanic peaks have evergreen forest supported by frequent cloudiness even during the dry season. See the figures below for the geographical and climatic situation. Because Google Photos and WordPress don’t have “no-transition” options, I have chosen to display the relief and vegetation relationships via the image-comparisons below.
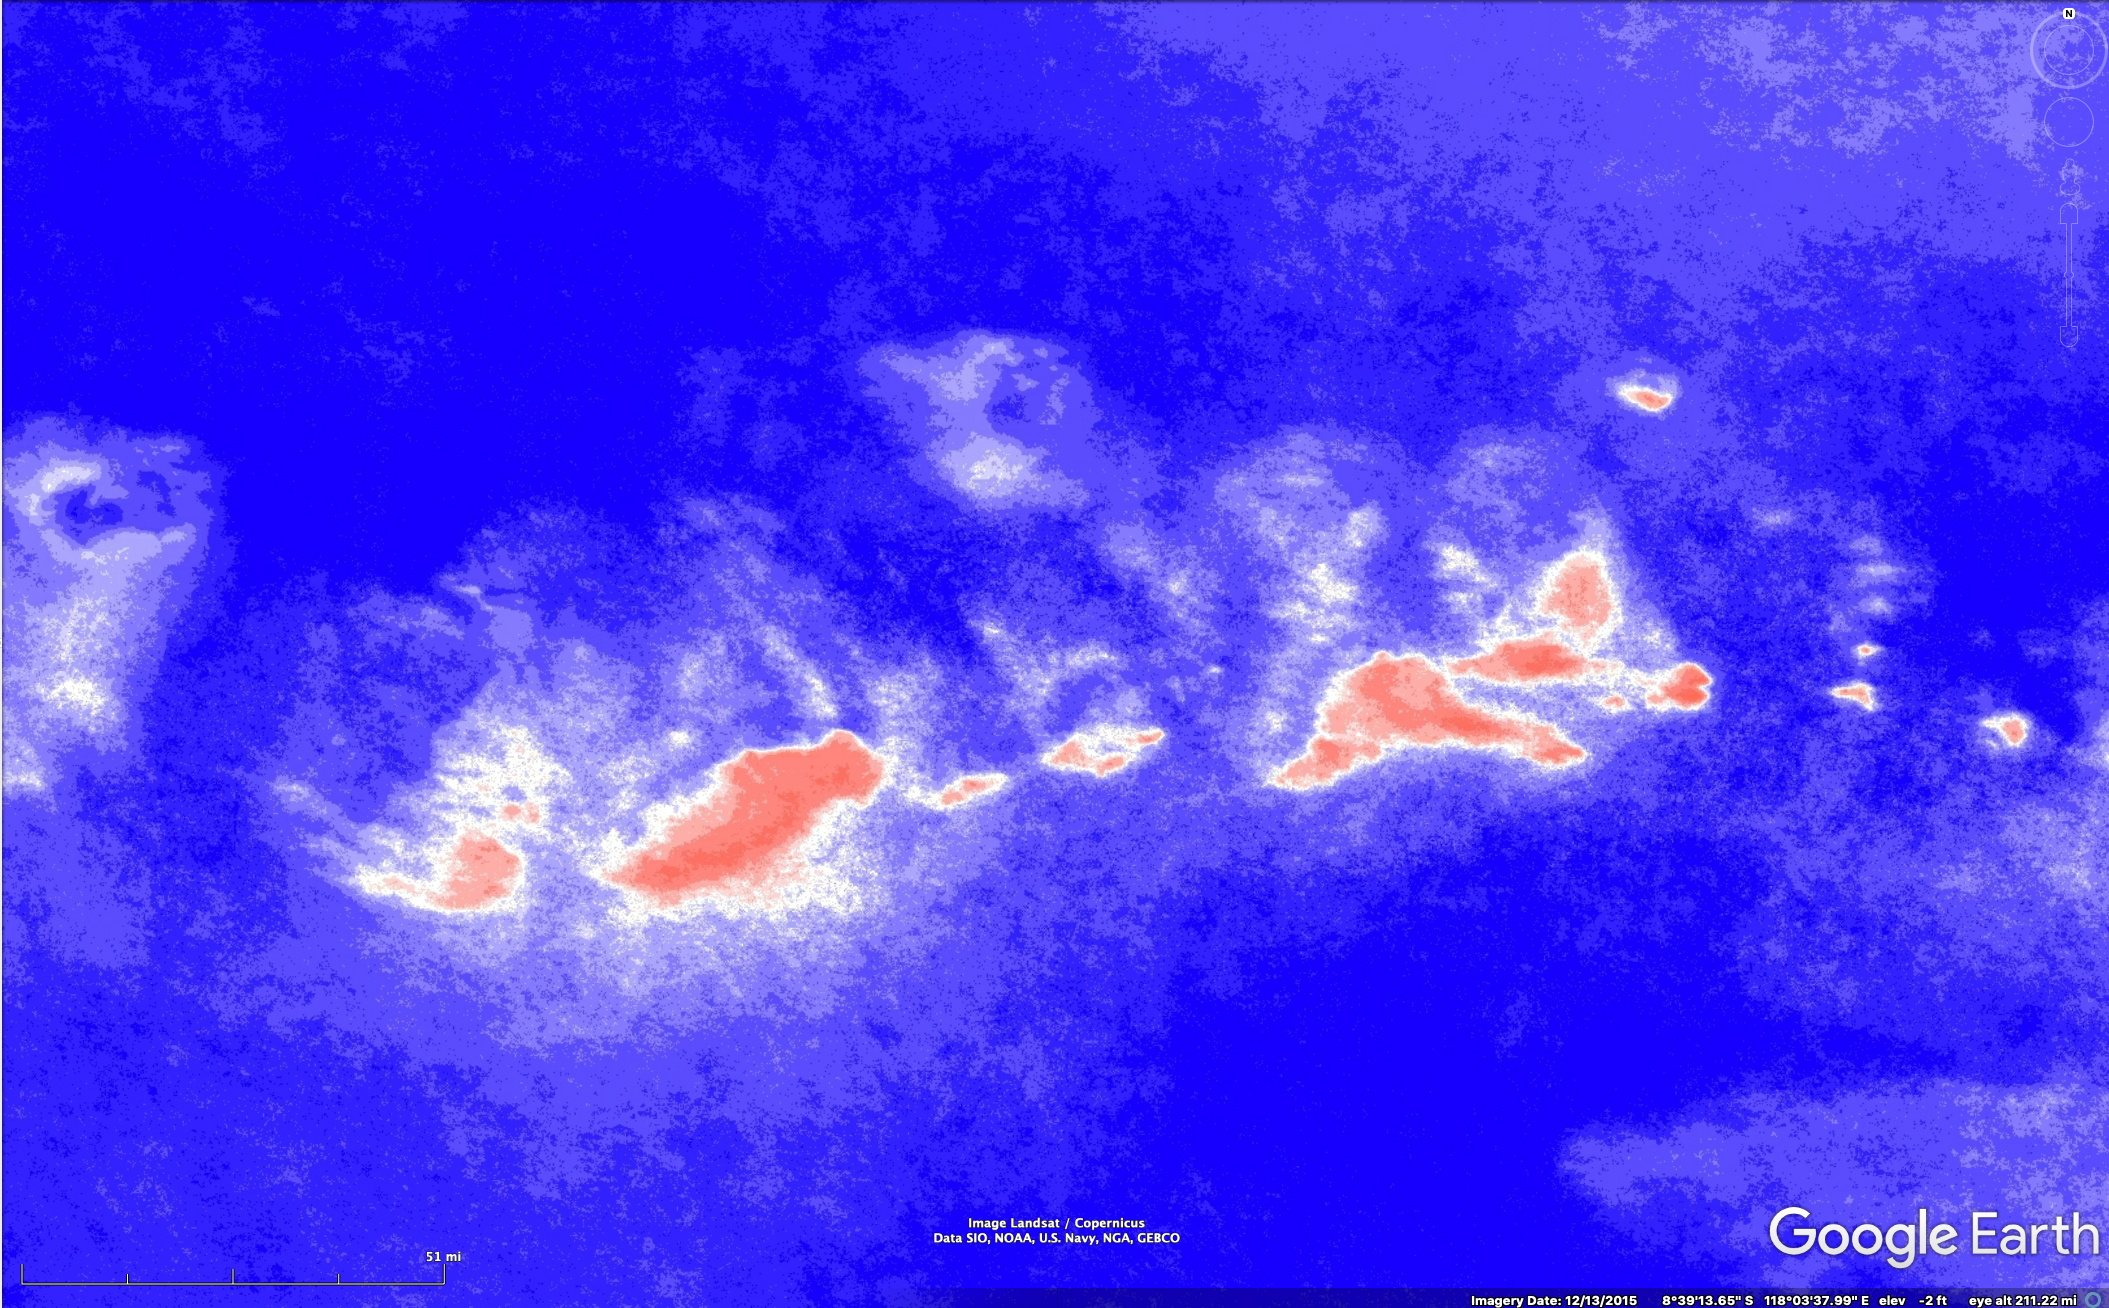


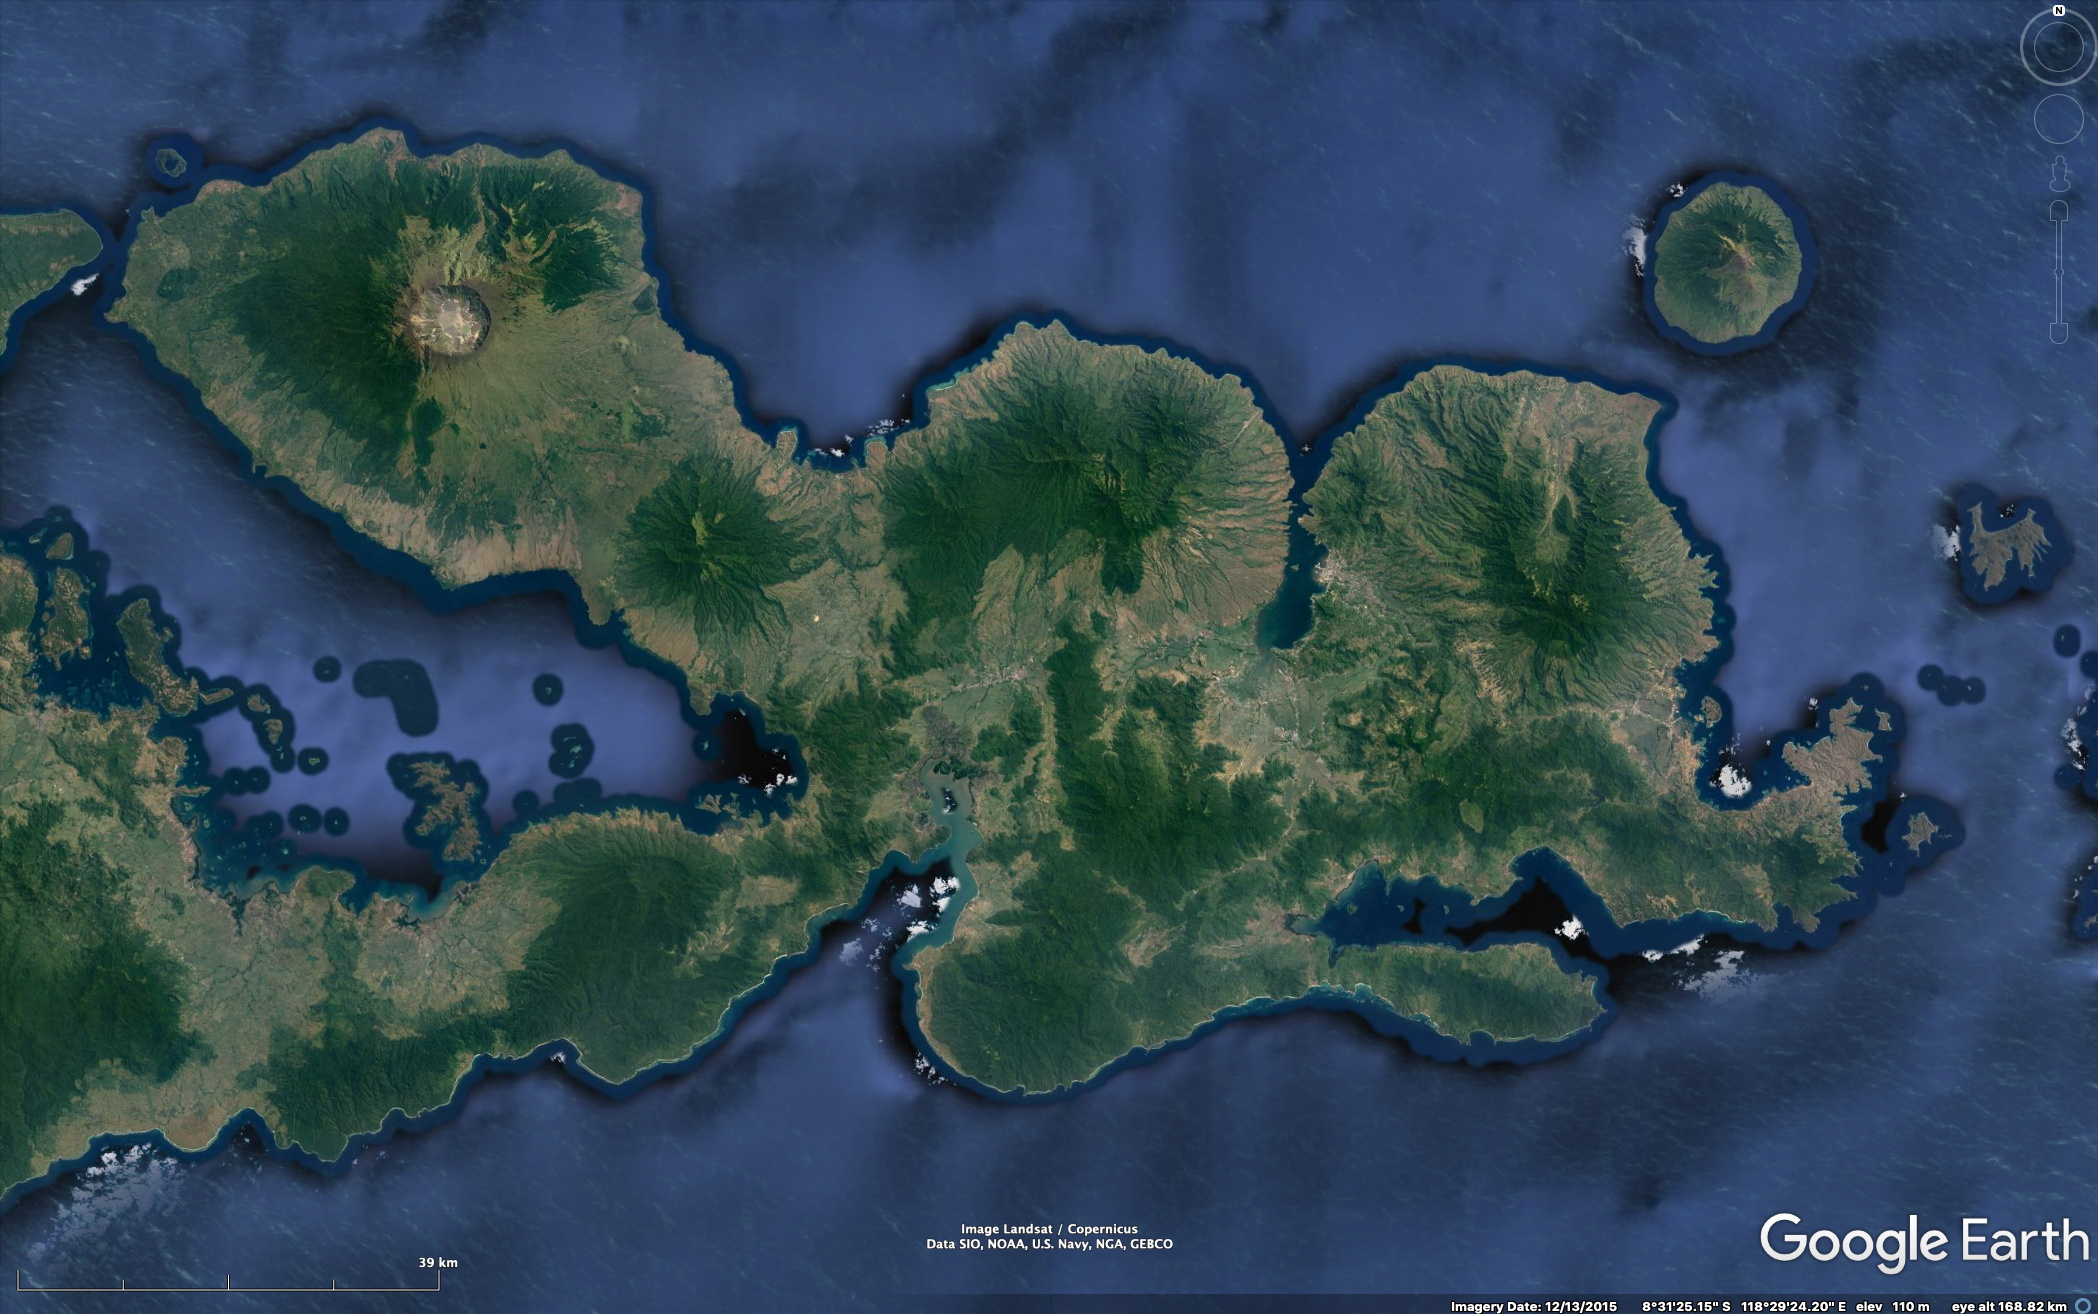
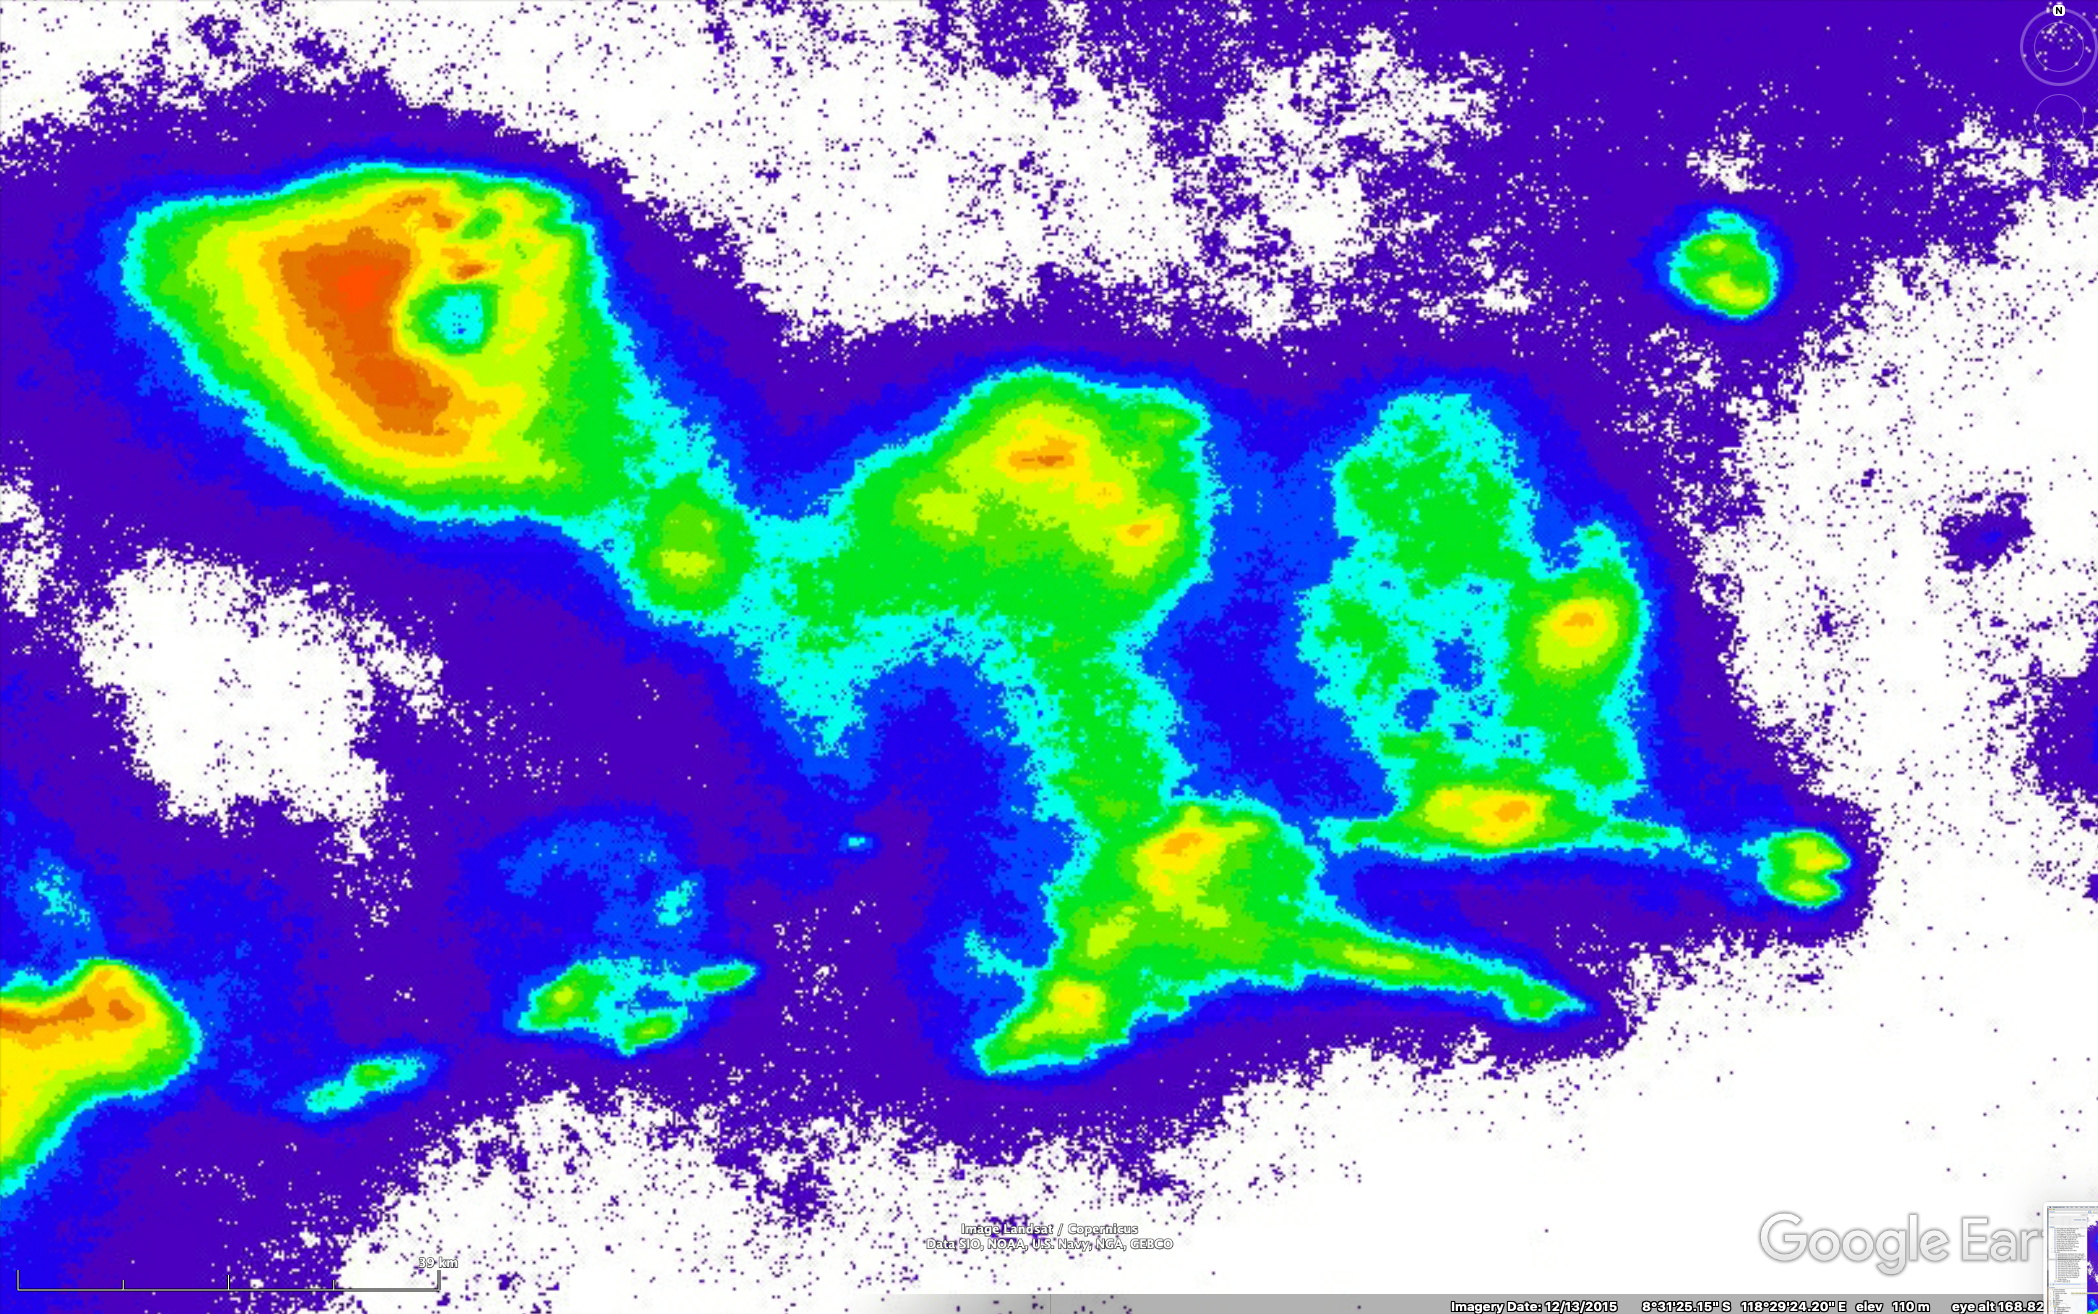
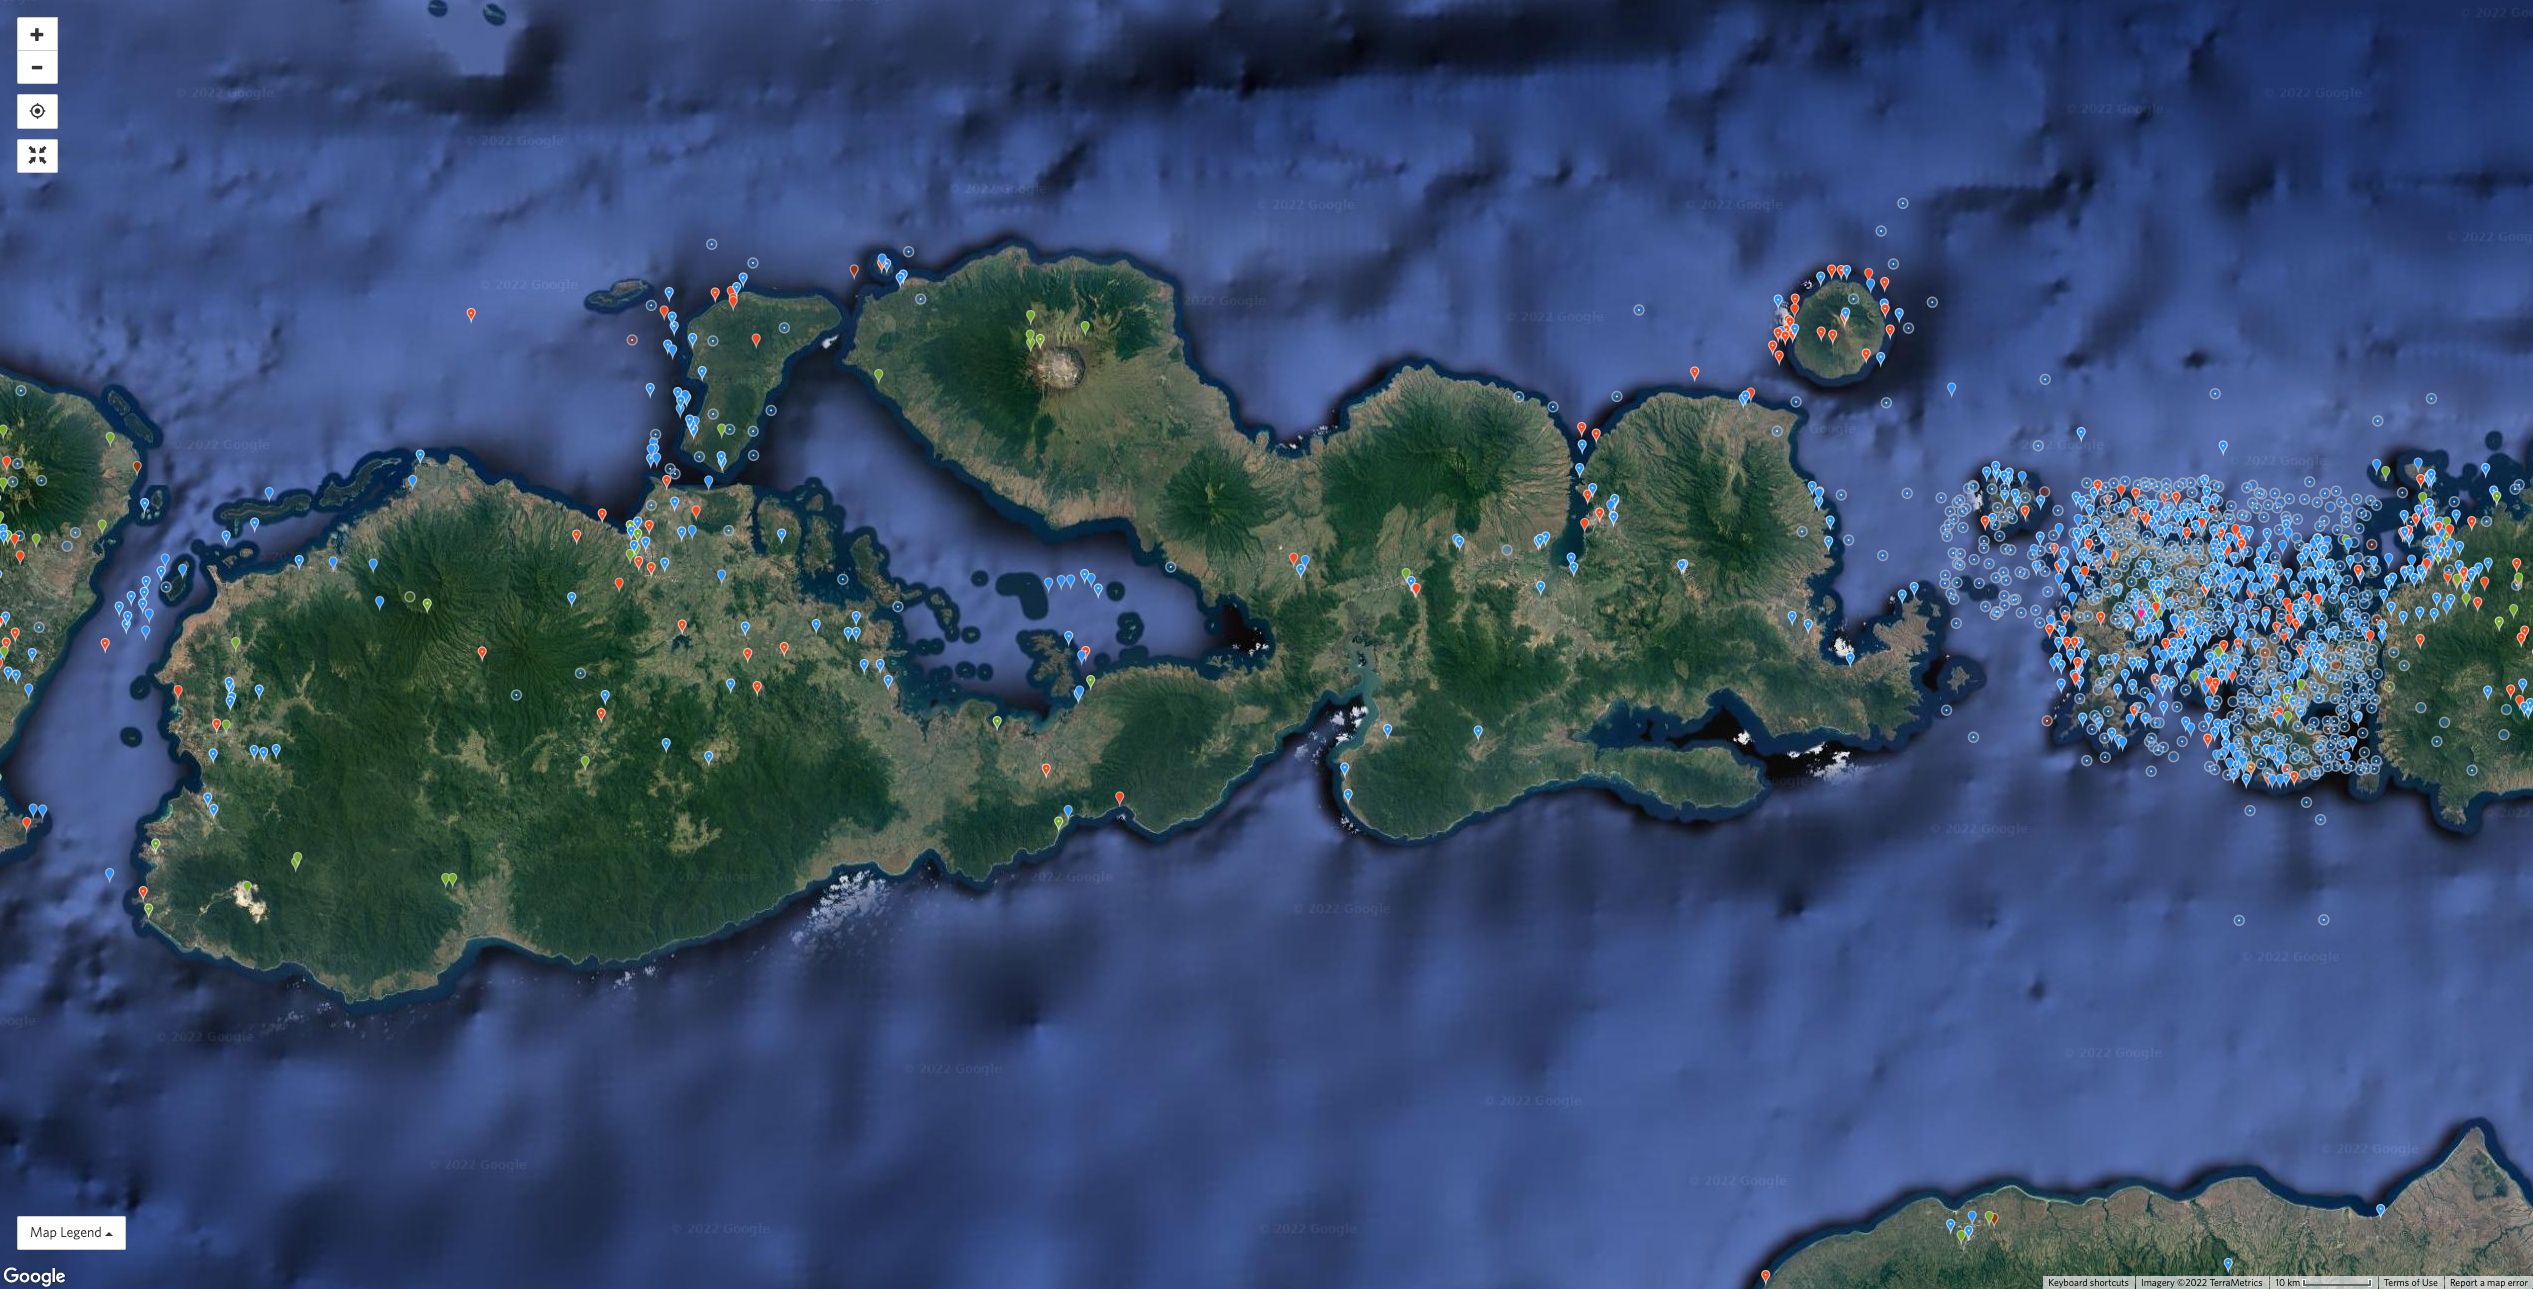
What is clear from the above imagery comparisons is that the cloudiest regions during the dry season are very poorly sampled by iNaturalist observations. Also, the regions of maximum dry season daytime cloudiness are not easily predictable from the topography or vegetation patterns alone. Some of the satellite climatology products may be useful in guiding sampling efforts by both citizen scientists and formal research scientists.
Some obvious biogeographical questions arise from the imagery shown above. Do these mountains have similar biota? Or has speciation occurred among the biota that are unable to migrate easily across the intervening lowlands. Are these mountains effectively “sky islands” on a larger island? How much biodiversity is being missed by the undersampling of the mountainous and forested areas of the island? These are general non-technical biogeography questions; specific questions might relate to individual groups of organisms or individual species. All would require many more observations than currently exist. (This discussion assumes no non-iNaturalist observations exist – this is certainly not true and many specimens from the island must exist in museums around the world. Whether they sample well the various isolated mountains on Sumbawa is another matter.)
To devise an effective sampling strategy for the highest priority areas on the island would be a logical next step. This might include mounting a few expeditions with many observers to remote mountain locations (possibly costly and time-intensive) or to sample more frequently the easily accessed sites at lower elevation. The latter might be more feasible, but also more likely to sample human-altered landscapes and to observe species already observed. The remote expedition sampling strategy would be more complex to arrange but would likely produce more novel observations – and provide a more motivational experience for those who participate.
How to identify local iNaturalists for survey work
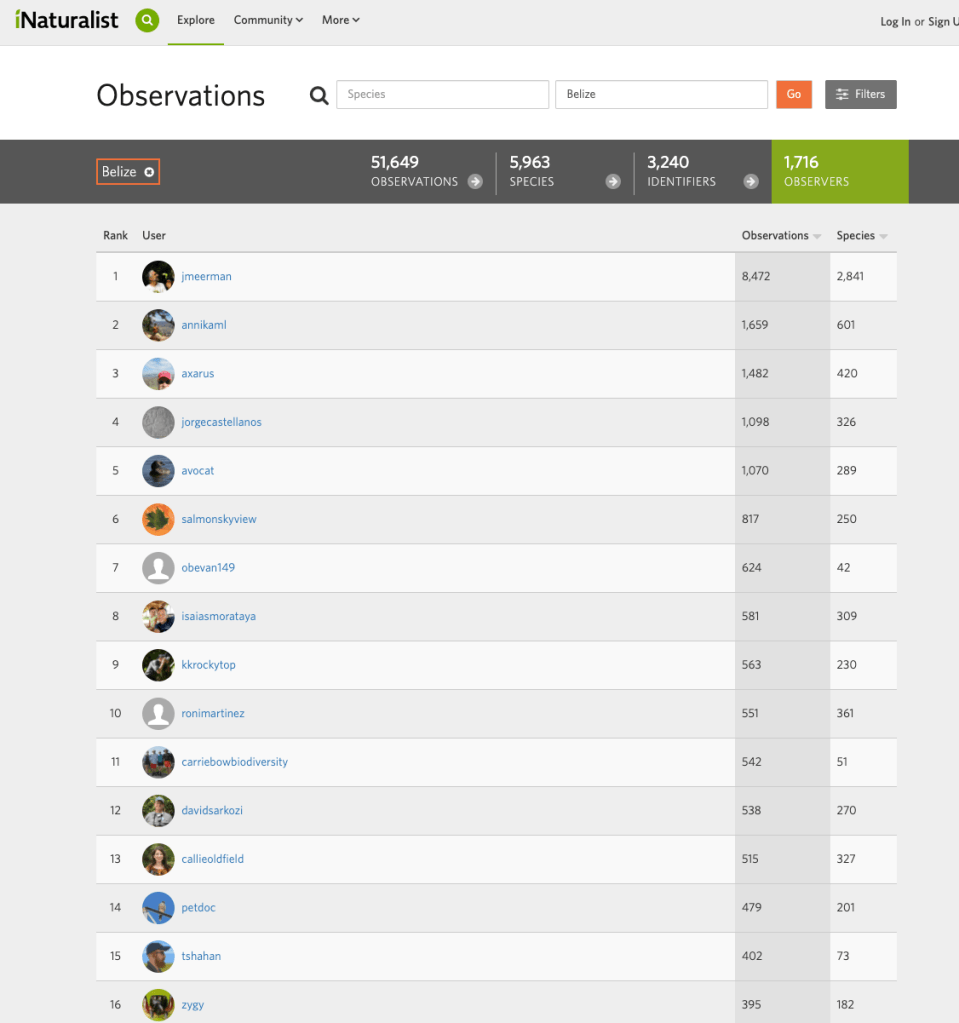
A straightforward way to identify active iNaturalist individuals is to search a region for the top iNaturalist observers. An example is shown for the country of Belize below (iNaturalist observations from the island of Sumbawa could not be separated cleanly from other areas/islands). Perusing the observer’s online summary will allow local observers to be identified and then contacted. If a number of such individuals can be contacted they can continue the process of identifying other locals to help with “expedition” planning. The local iNaturalist’s can also train other observers to participant in the expedition.
As with iNaturalist observations, observers reporting on eBird also can also be stratified by observations (checklists) for any country. These require more scrutiny, since many are tourists or birding tour guides to popular birdwatching countries. High-count eBirders are often also frequent iNaturalist contributors as well.

An actual expedition to an isolated location would benefit from a number of participants, each specialized to a certain degree. For example, in some countries, binoculars might not be common, nor cameras with good telephoto lenses. A “birding” subgroup might use the available binoculars and telephoto-equipped cameras to locate and document birds. Another subgroup might locate invertebrates under logs, along tree trunks or in foliage. Smartphone cameras would suffice for such observations (though best-practice procedures should be used to document key features of such biota). A plant subgroup might collect herbarium specimens, after photographing them in the field. Together, the group should be able to describe a great many biota.
There would be an iterative process of improving iNaturalist expeditions with time. But such expeditions, carried out perhaps every few months, would be able to eventually sample many of the current data voids on the island of Sumbawa that was discussed above.
Perhaps the most important by-product of the iNaturalist expeditions would be the building of a cadre of citizen scientists capable of instilling this interest in others. The best teachers will be those locals who have a deep understanding of how iNaturalist works and who see the benefit of making the observations. For this, they will need motivational feedback from scientists that use their observations.
