Climate of the Hawaiian Islands
Some basics of the climatology of the islands are presented here. Books (e.g. Sanderson, M., Prevailing Trade Winds: Weather and Climate in Hawai’i, 1993) have been written about the climate of the Hawaiian Islands and innumerable research studies have focused on aspects of their weather and climate. The best easily available source of climate information about the Hawaiian Islands is the webpage maintained by the Geography Department of the University of Hawaii. Note that the most interesting page is actually that describing the rainfall of the islands. We put more than normal emphasis on the climate and weather of the islands because we know (from our recent trip) than many tourists have only a poor understand of the Hawaiian island’s geography and climate. Aren’t the Hawaiian Islands all green, warm and with palm trees everywhere? The short answer is no, to understand this answer requires you read the section on climate of the islands. For those wanting a less complex summary of Hawaii’s climate see this one by the Western Region Climate Center for the state of Hawaii.
Temperature on any of the Hawaiian islands is mostly a function of altitude. The temperature decreases with altitude at a rate of about 3˚F per 1000 ft. This does vary from day to day and even with the time of day, but for most visitors this is a tolerable estimate. A “well-mixed” atmosphere on Earth displays a lapse rate (decrease in temperature with height) of about 9.8˚C per km. Converting to English units gives a value of close to 5˚F per 1000 ft. However, in Hawaii and elsewhere the average lapse rate is closer to 6-7˚C/km (about 3˚F per 1000 ft elevation change) and depends on the day and even time of day. During our last descent from 10,000 ft elevation at the top of Haleakala on Maui to near sea level, taking about 45 minutes (near sunset), we saw the temperature rise from 45˚F to 77˚F. A great many tourists do not appreciate these changes, and arrive at the Haleakala summit with sandals, shorts and T-shirts. With the wind, many visitors who were coming to see the sunset (a popular tourist attraction – one that we don’t favor) were scrambling to get inside the upper visitor center or back into their vehicles.

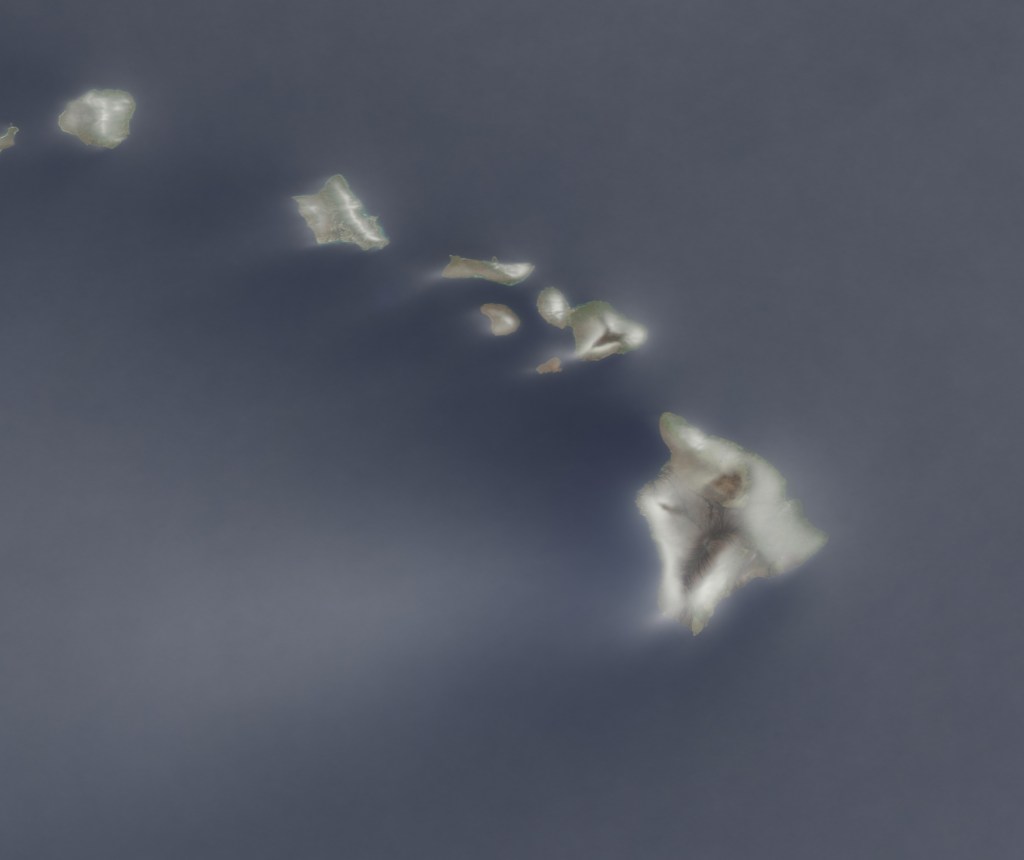
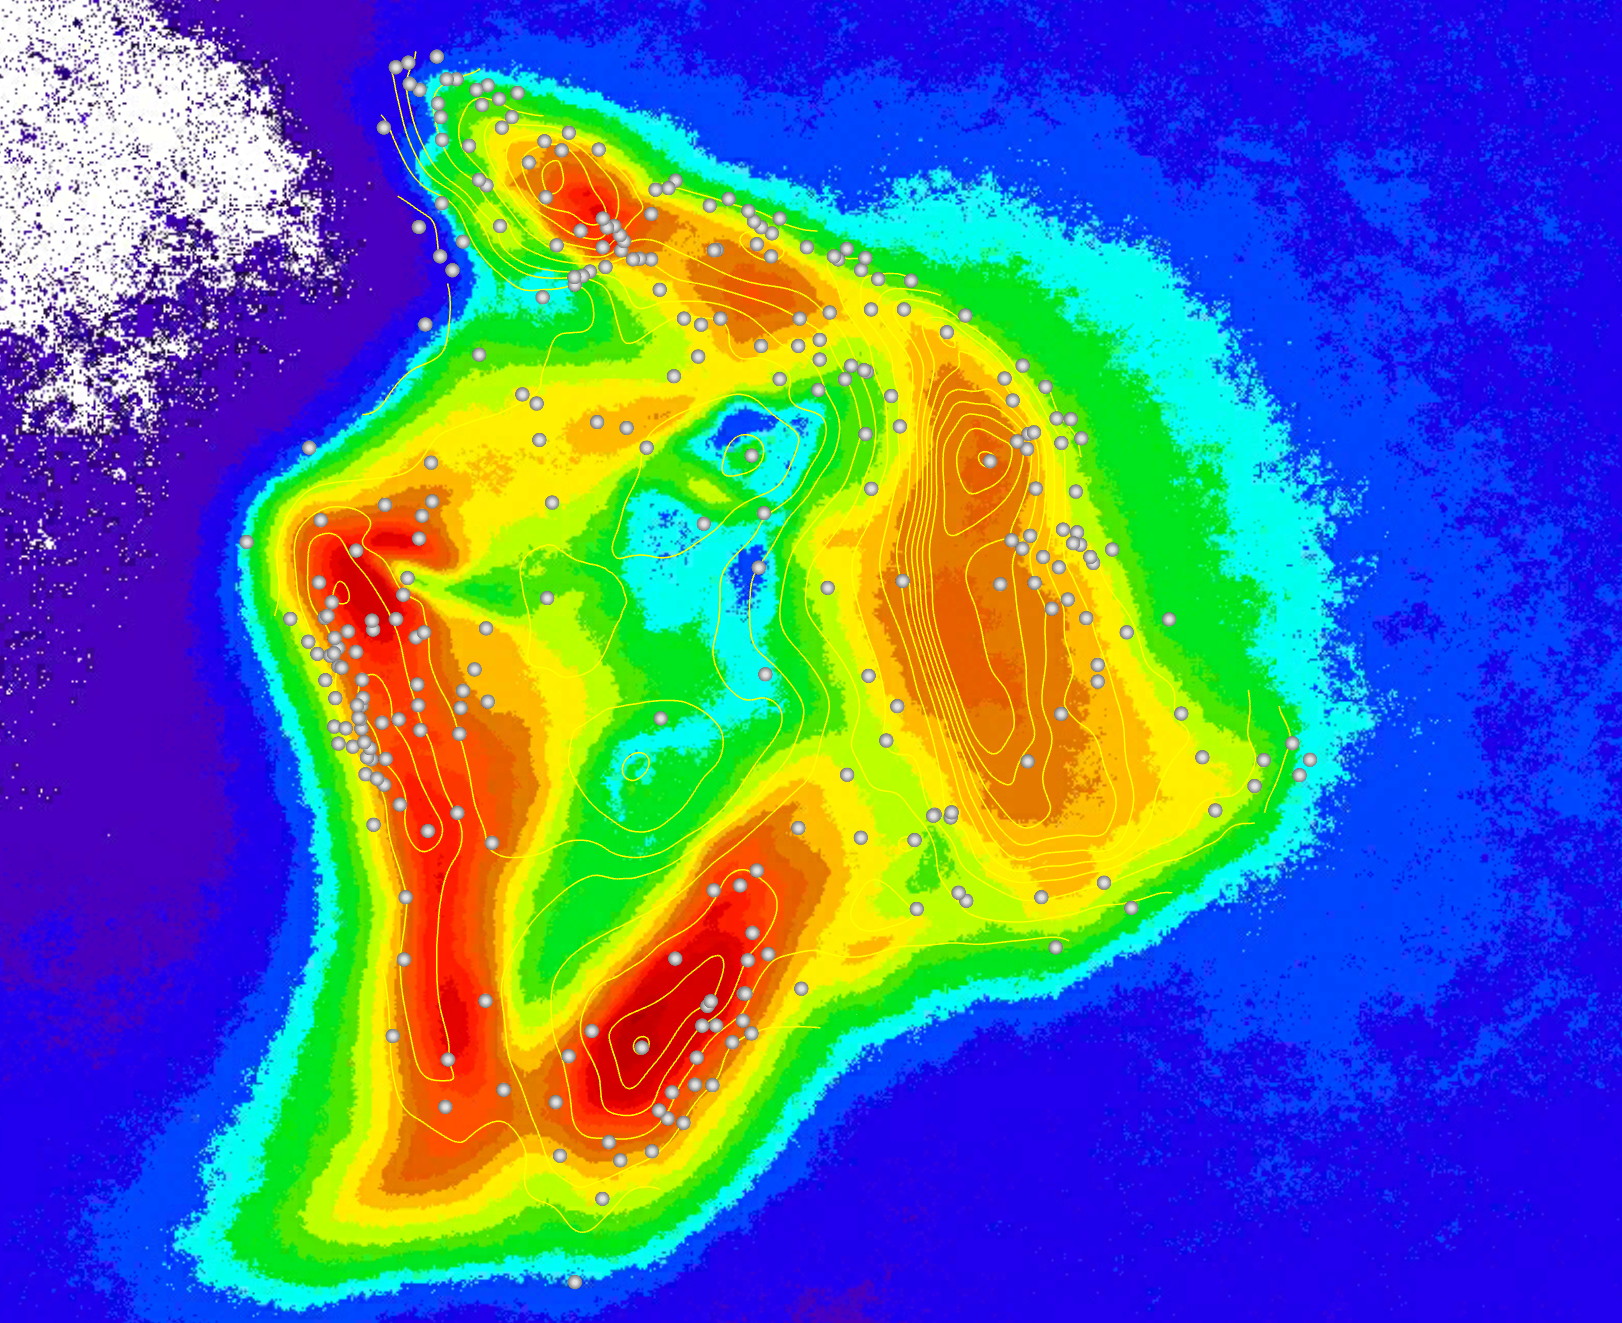
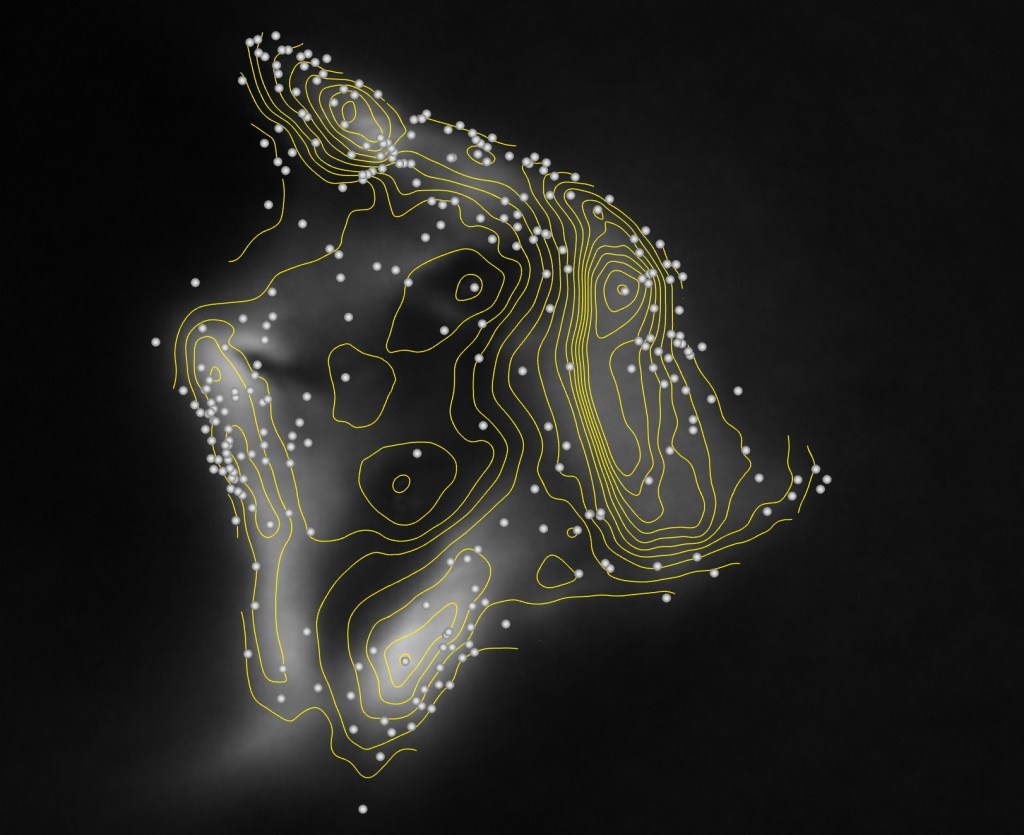
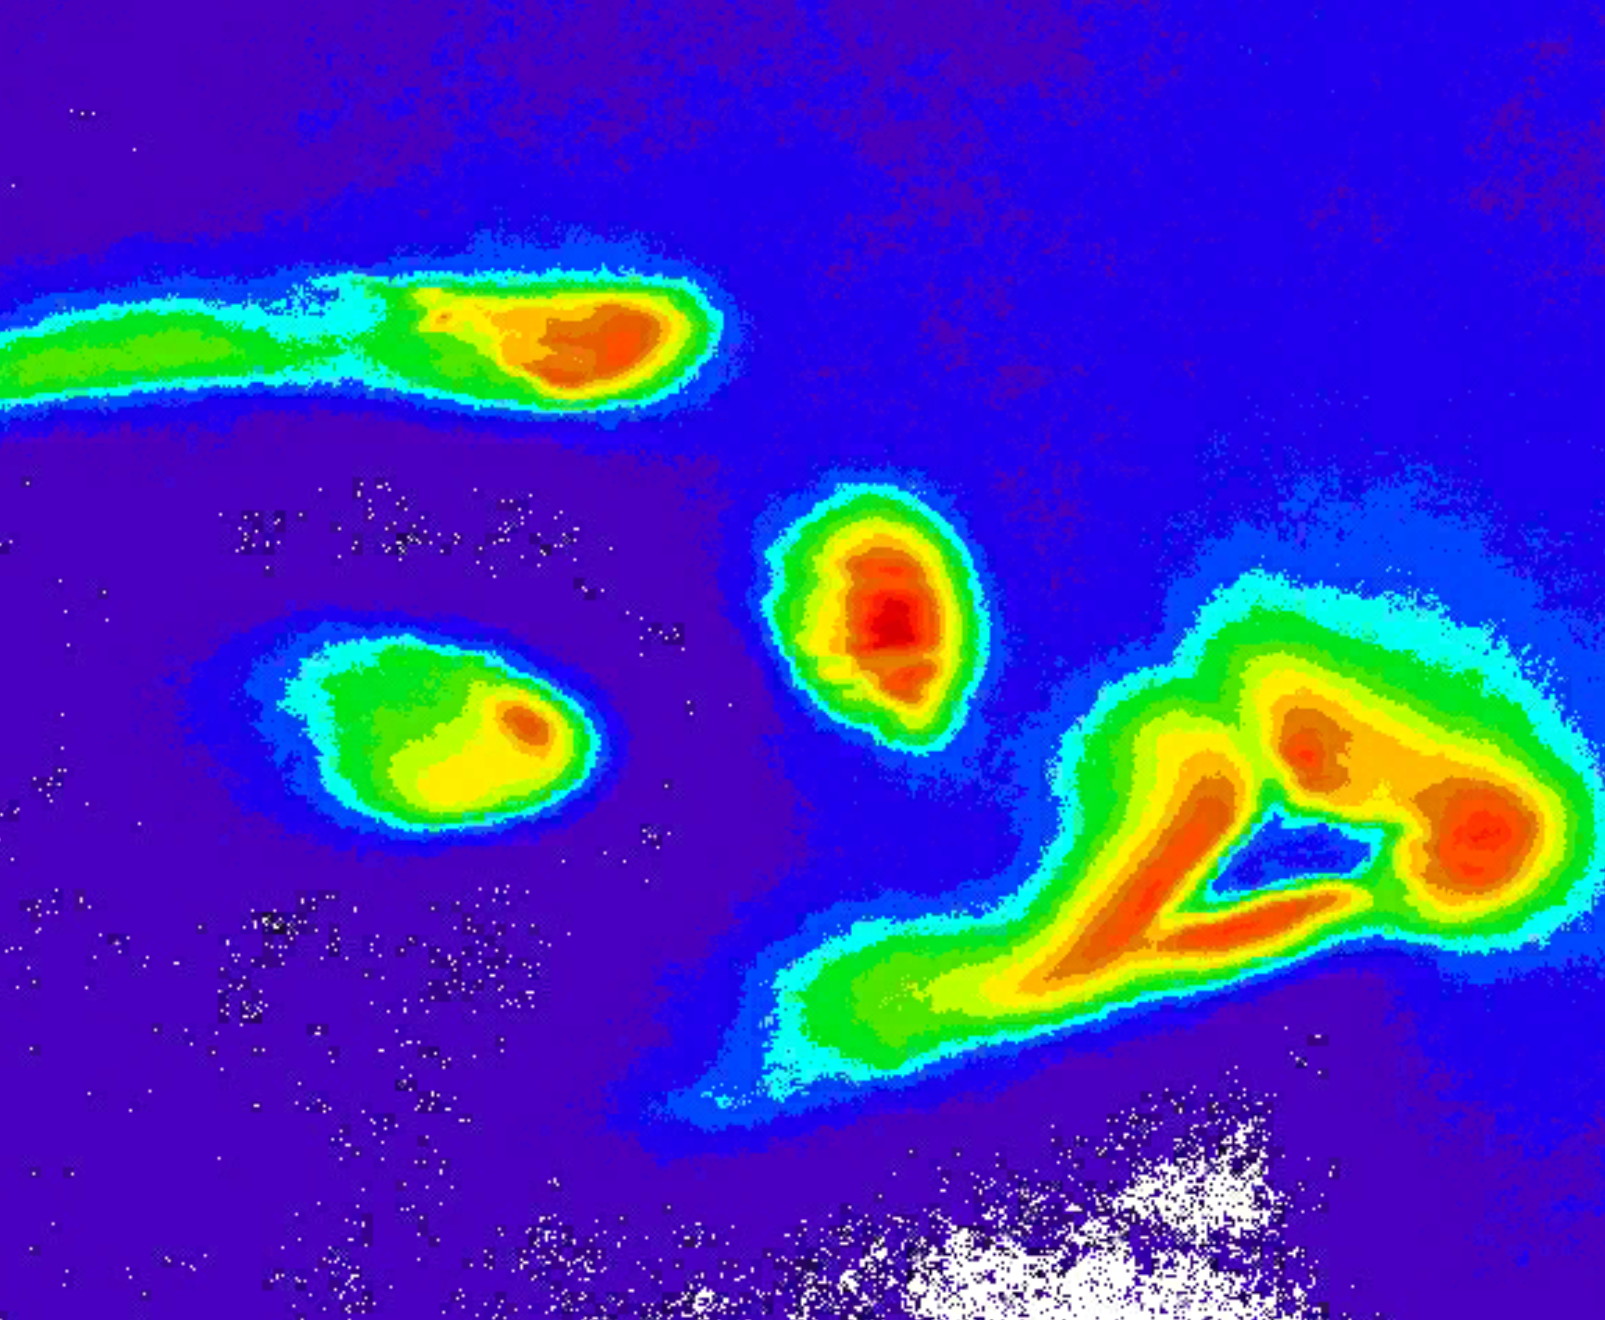
An average of mid-day cloudiness around the islands is shown in the figure below. The first image shows what you might see with your eye if you could average the satellite imagery over a few years. Over the ocean brighter areas are where there is more cloud cover, darker areas are less cloudy. Over land the land brightness complicates the interpretation, though cloudy areas are still apparent. The lava flows from Mauna Loa on the Big Island are evident. The second image shows the average cloudiness with the color table going from very frequent cloudiness (red) to minimal cloudiness (white ). A grayscale version of the same data is shown in the third image.


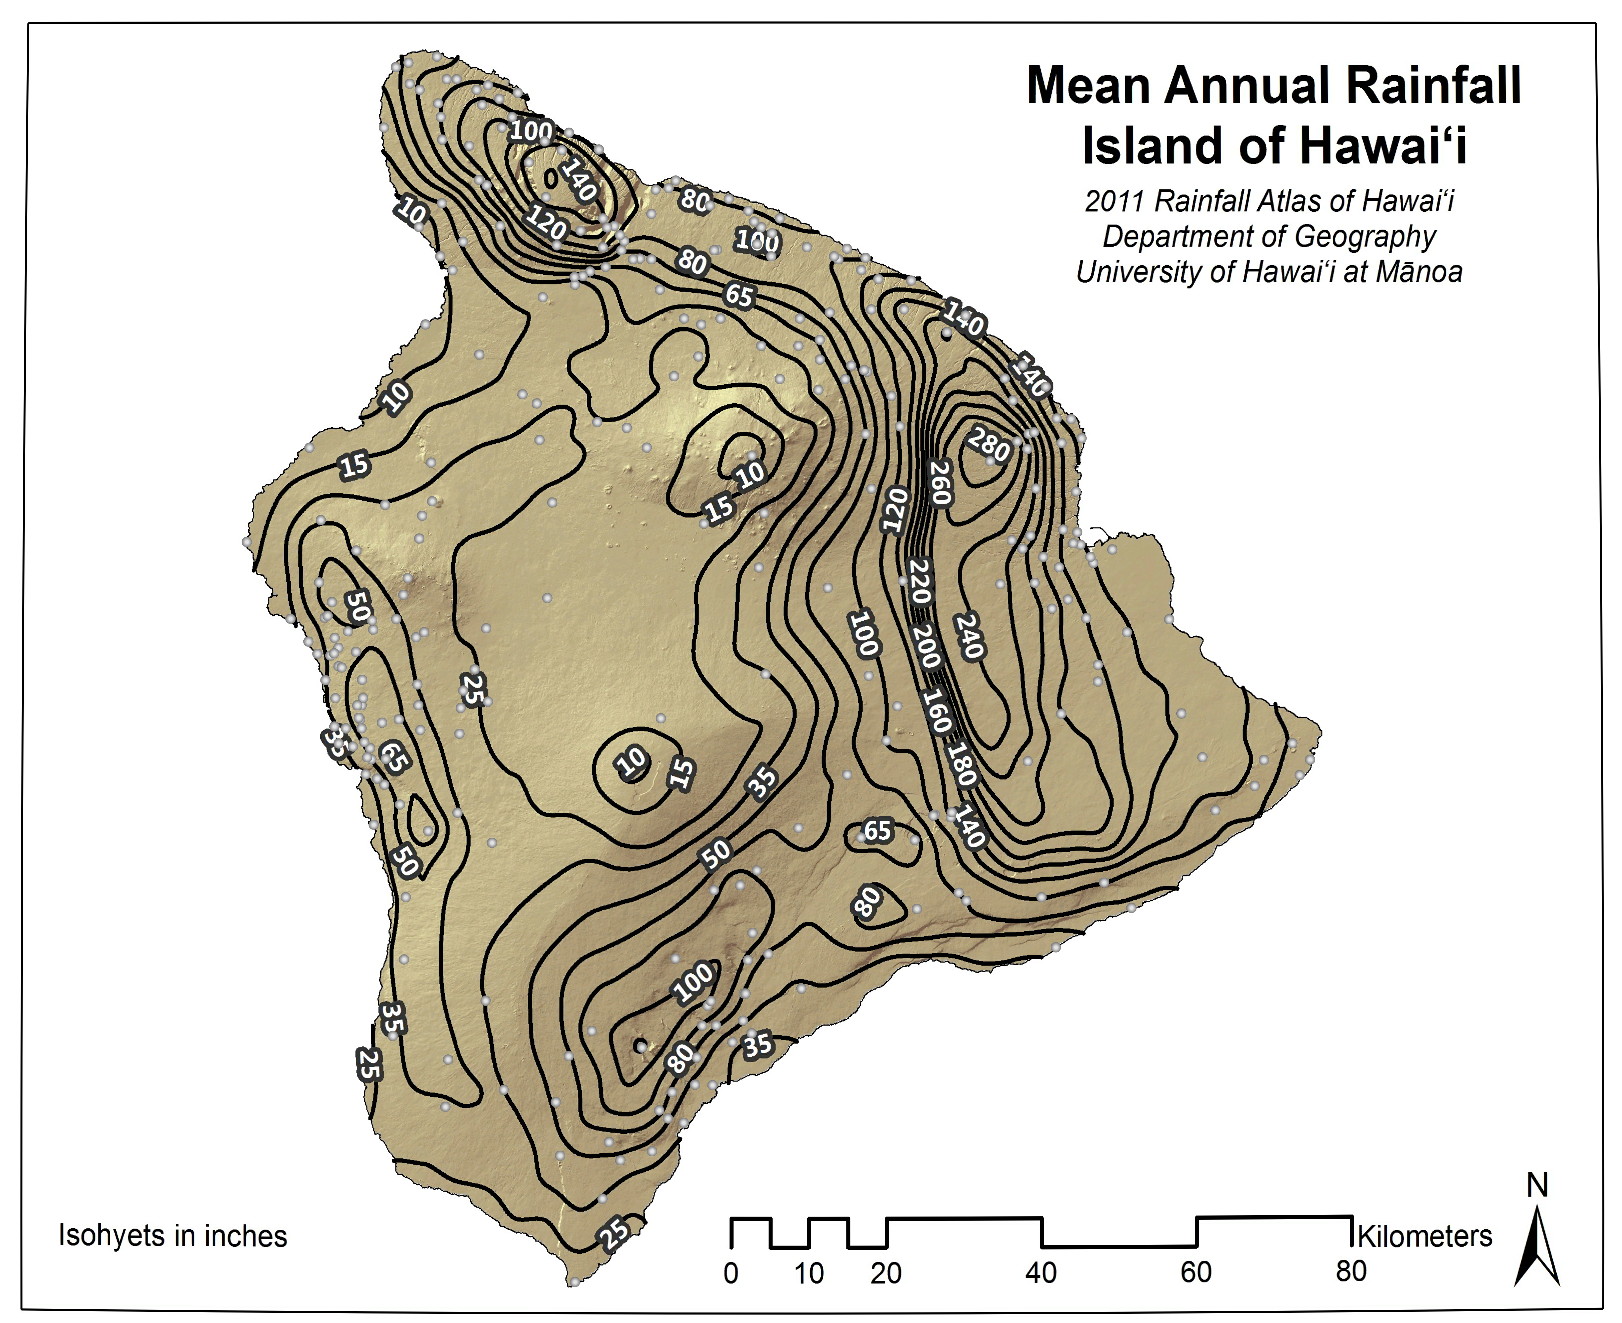
The average cloudiness does not exactly correspond to the actual rainfall distribution – some areas of equal daytime cloudiness receive different annual rainfall. This can be due to the clouds not raining equally, or the twice-daily satellite imagery doesn’t represent well the rainfall at other hours – especially at night. Annual rainfall maps prepared by the Geography Department at the University of Hawaii are the most useful estimate of precipitation on the islands. See their online atlas here.
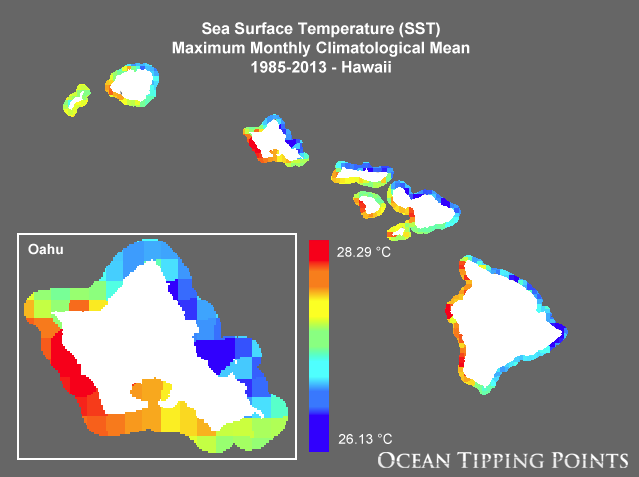
There is a common perception that the water is warm in Hawaii, and to a fair degree this is true. However, during winter it is not as warm as locations in the Caribbean Sea and during the summer the Gulf of Mexico is decidedly warmer. See the climatological maps below; during the coolest month (March) the sea surface temperature around the Hawaiian Islands is near 24˚C (about 75˚F). In September (typically the warmest month for water in much of the Northern Hemisphere) the Hawaiian waters are approaching 27˚C (80.6˚F). While this is certainly comfortable for swimming, it is still cooler than much of the tropical western Pacific – where the greatest diversity of corals and associated marine life is found.

You can see the annual cycle of SST for the Pacific Ocean from an IRI webpage here. More IRI climatologies can be found here; all of these are from gridded data sets produced via the aid of assimilation models of one sort or another.
Another source of basic SST climatology is found at the Pacific Islands Ocean Observing System website. Maps of many oceanic products are found here, including three Sea Surface Temperature climatology products shown in the figures below. These are useful for understanding things like where to surf in Hawaii, where to swim and snorkel, and why the Hawaiian Islands are not as coral-rich as other places farther west in the Pacific Ocean. See the captions for each figure for more details.


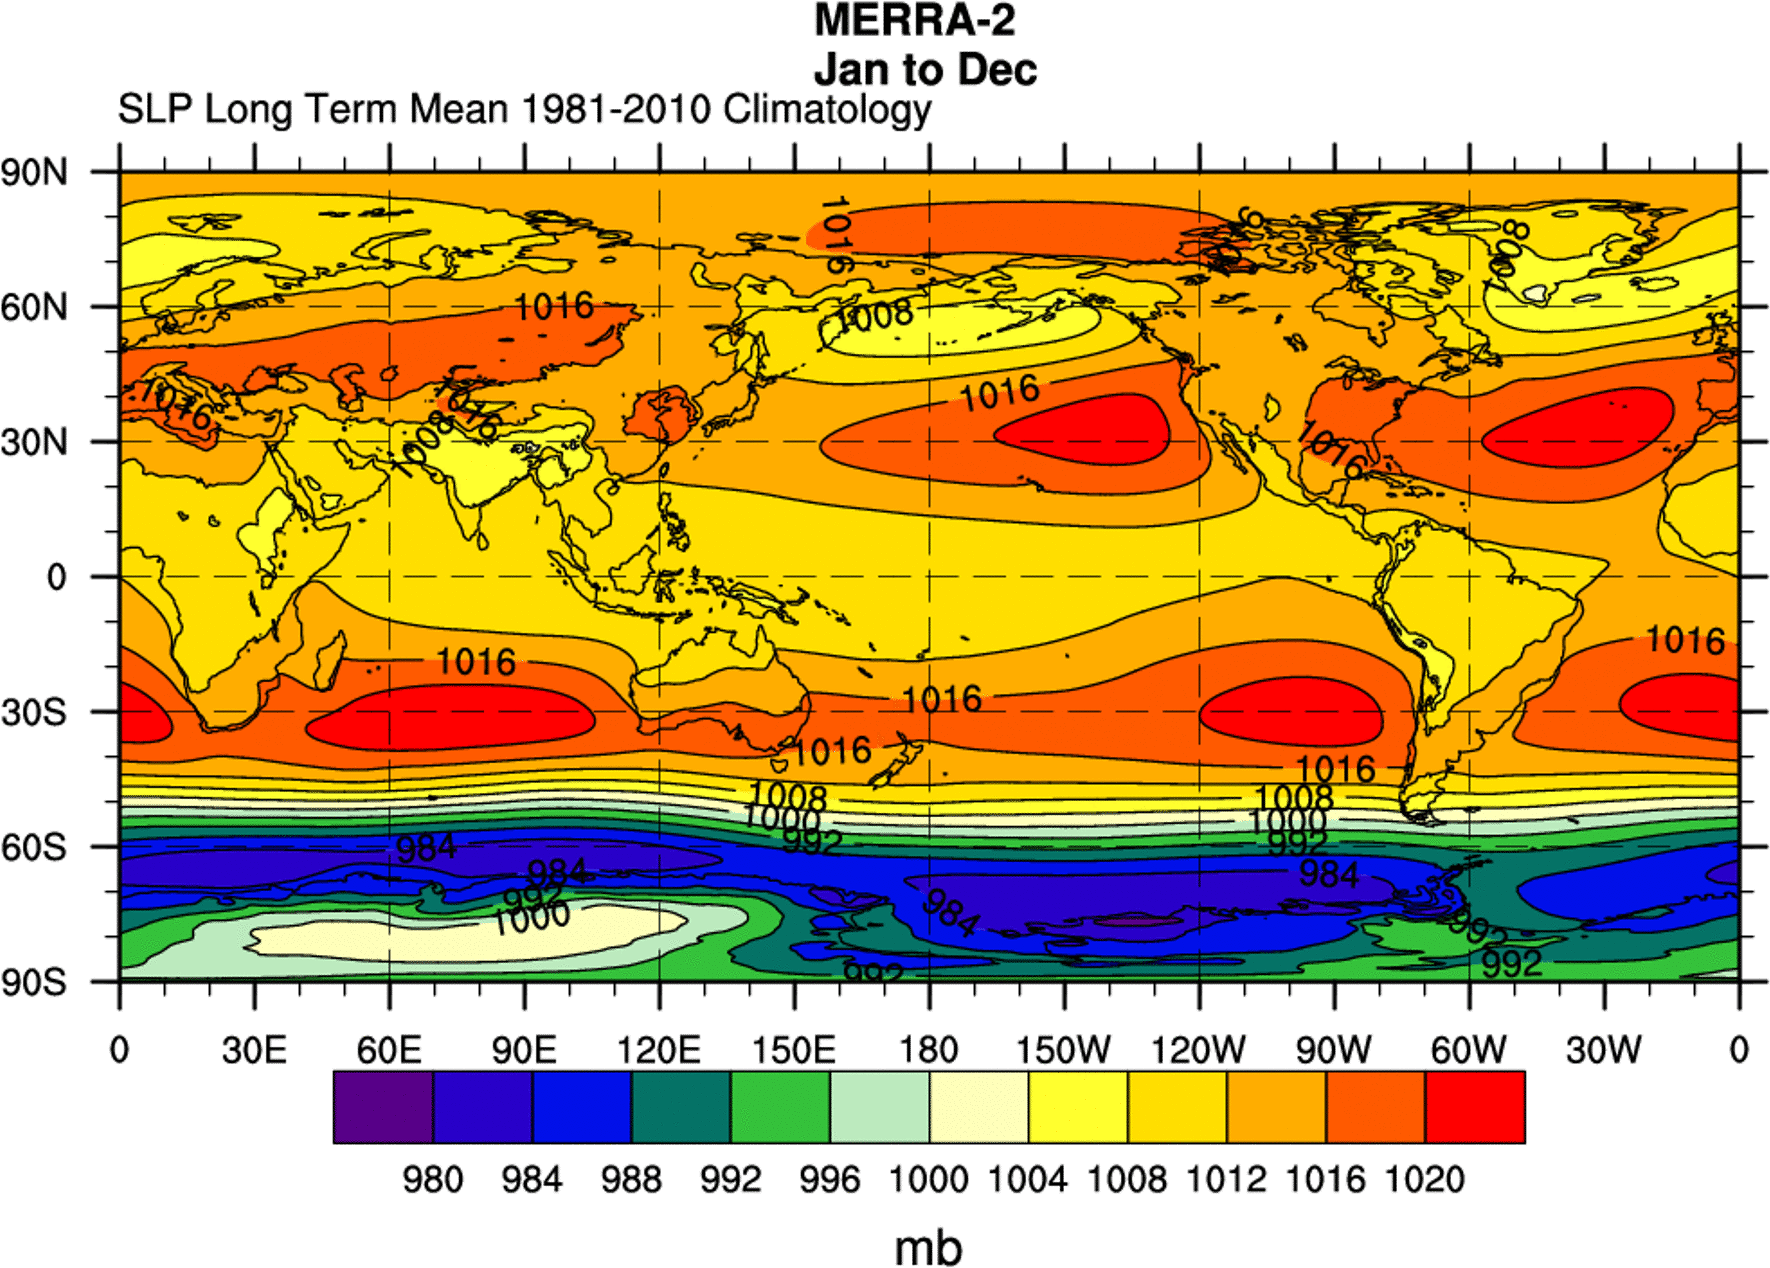
A key aspect of the climate of the Hawaiian Islands in their location – immersed in the “trade winds” on the southern side of the subtropical high pressure zone that extends (on average) across the north Pacific subtropics. See this link for the mean winds over the northeastern Pacific Ocean for any month – the link takes you to August at the 1000 mb pressure level (a few hundred feet above the surface on average). A prettier depiction of monthly mean surface winds, based on surface roughness measured by satellite, is at this site. These very steady winds are from an easterly direction on most all days – though they often vary from northeast to southeast and infrequently (mostly in winter) from a westerly direction. The sinking motion associated with the subtropical highs (note that the air flows out from a high pressure area at the surface must be replaced (in a steady state condition) by air that is sinking towards the surface) results in a relatively sharp boundary between moist air near the ocean surface and much drier air that has descended and caps the moist layer. The differing trajectories of these air masses results in a nearly constant presence of the trade wind “inversion layer” at the top of the trade wind moist layer. This boundary usually found near 2-3 km altitude, depending on the day and it does vary.
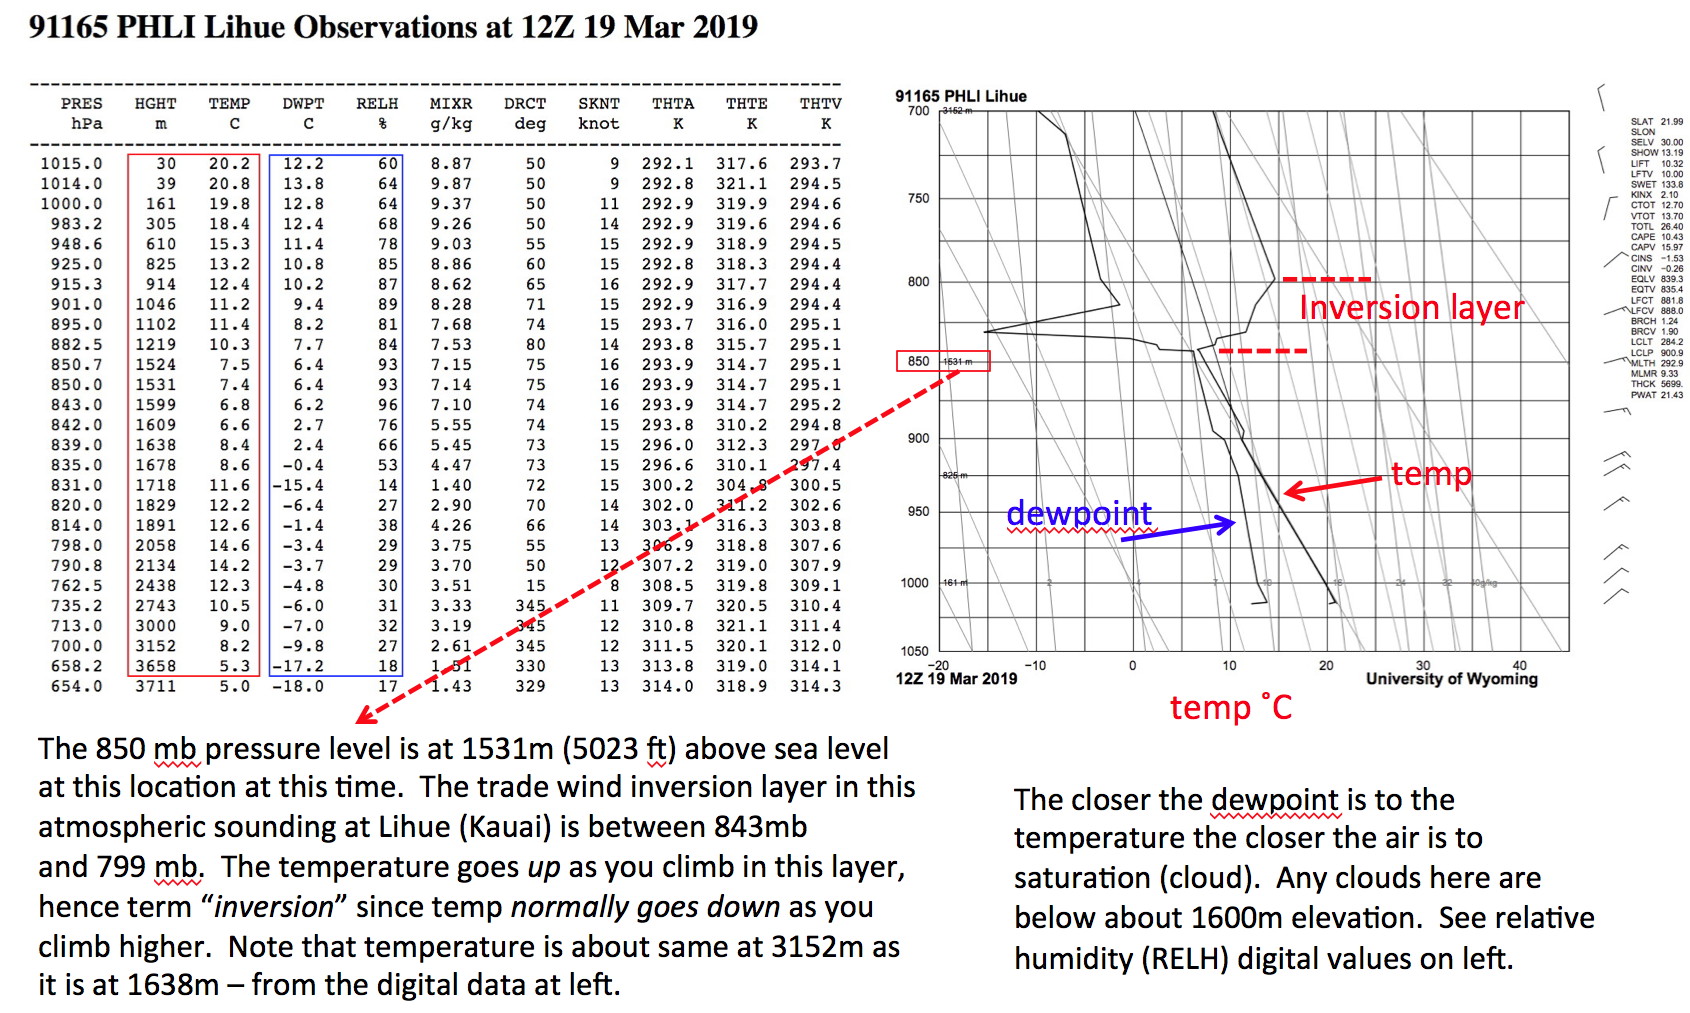
The presence of the trade wind inversion layer between 1.5 and 3 km above sea level means that on most days the upper elevations of Haleakala on Maui and Mauna Loa and Mauna Kea on the Big Island are above clouds and can be not only dry but somewhat warmer than might be expected. This is easiest to observe driving up Haleakala and watching your vehicle’s outdoor temperature (most modern cars can display this). The temperature will drop as you climb, then as you pass through and beyond the cloud layer the temperature will go up – before starting to descend as you climb farther. Again, this is on most days…
Rainfall is a minimum on the high altitude peaks, though snow can fall during winter storms (rare on Haleakala but common on the higher volcanoes of the Big Island).
Mid-day cloudiness around the islands


The average cloudiness does not exactly correspond to the actual rainfall distribution – some areas of equal daytime cloudiness receive different annual rainfall. This can be due to the same amount of clouds not raining equally in different areas, or that the twice daily satellite imagery doesn’t represent well the rainfall at other hours – especially at night. Annual rainfall maps prepared by the Geography Department at the University of Hawaii are the most useful estimate of precipitation on the islands. See their online atlas here.
We show details for the each island on their respective pages. To see a current animation of visible satellite images (from 10 minute images from the geostationary satellite covering the eastern Pacific) from the last 4 hours see this link.
Hawaii
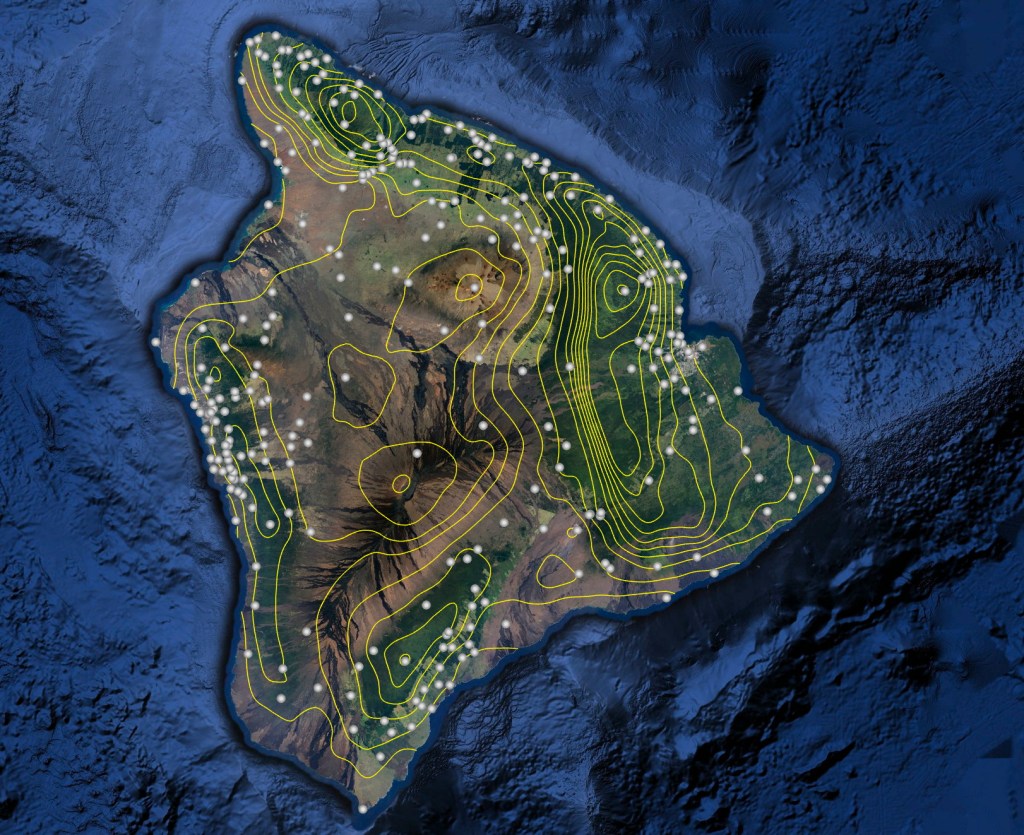
The figures below show the mean annual rainfall for the Big Island, along with mean cloudiness and the shaded relief and true color surface characteristics from Google Earth imagery. These are explained more fully in the individual captions.

Maui
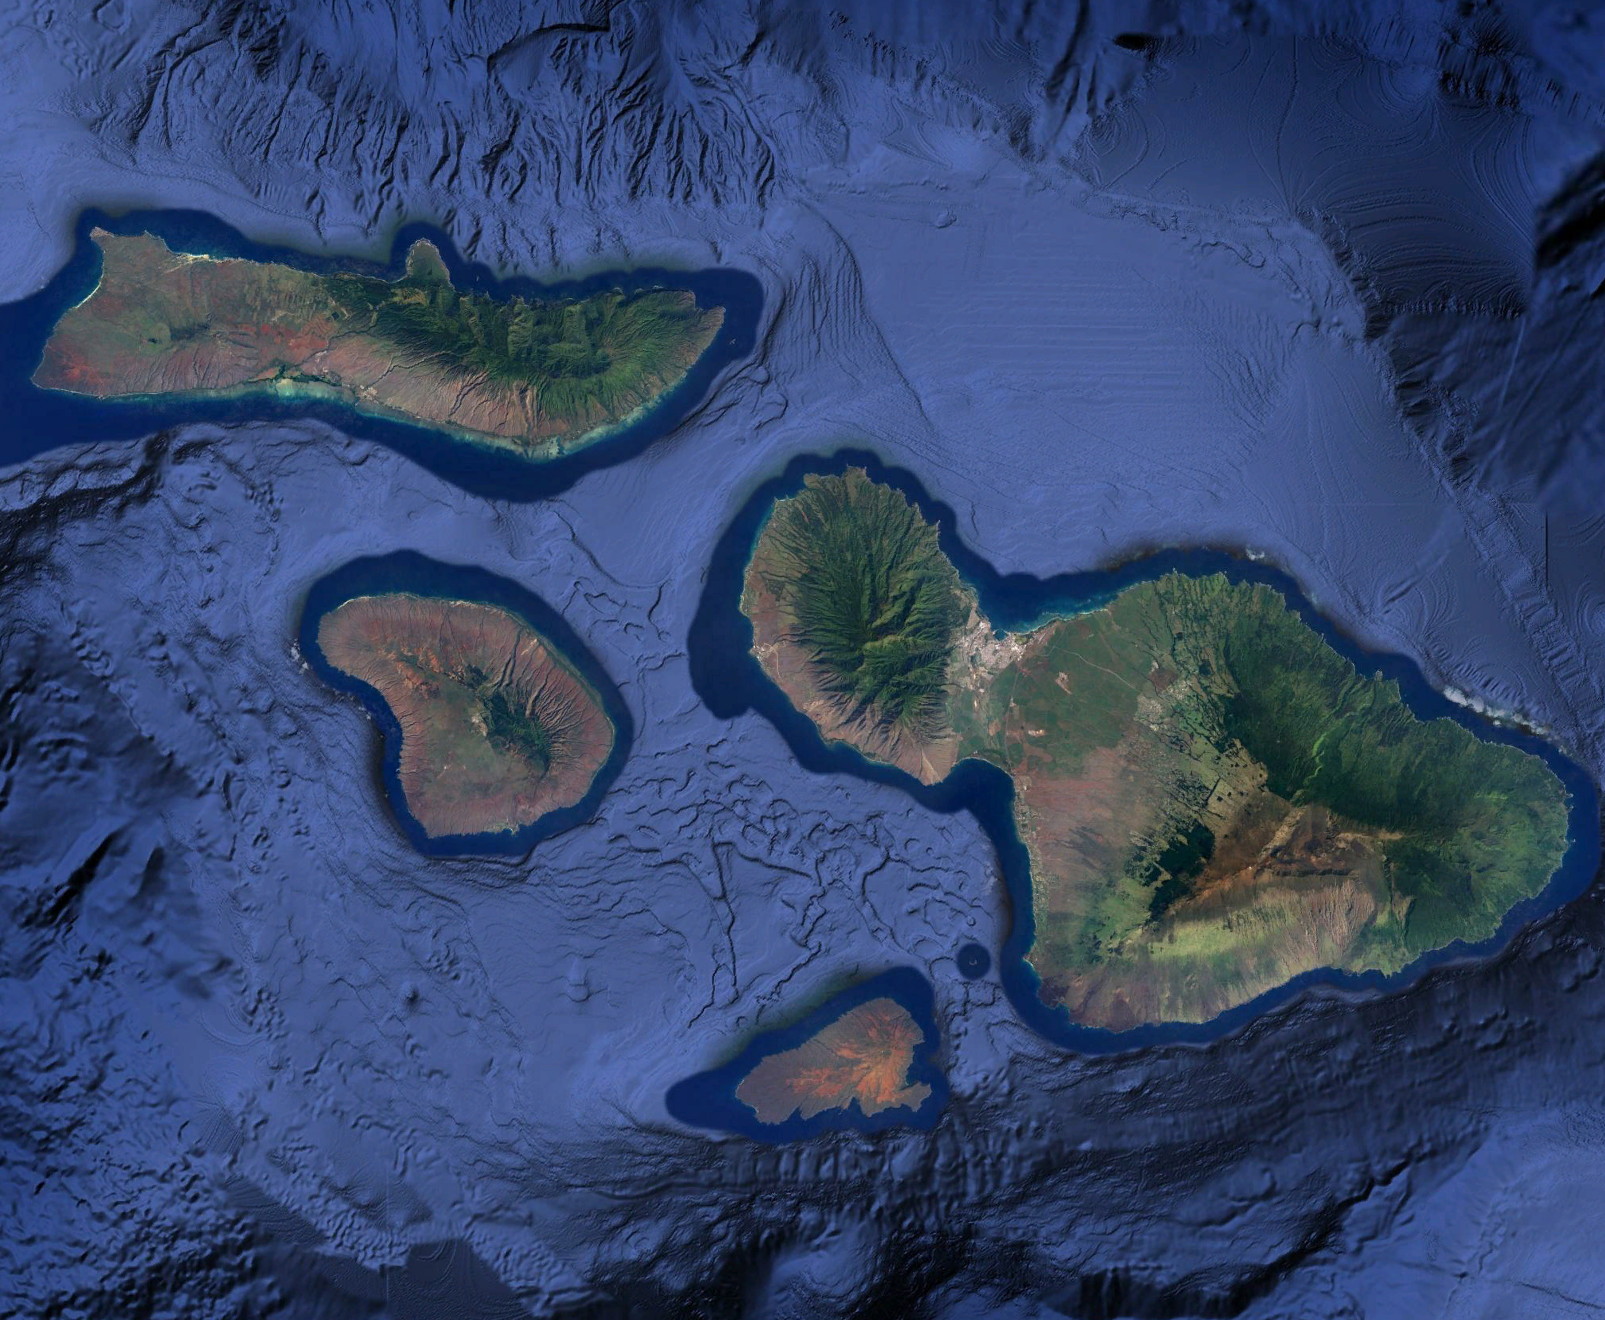
Rainfall analyses for Maui are shown below. The area shown is actually Maui Nui – the collection of islands that were connected during the last ice age (roughly 20,000 years ago) when these islands were connected.


Haleakala is a long drive from the resort areas on Maui – it is about 40 miles to reach the main visitor center that is at 7000 ft elevation. It is another 3000 ft altitude gain to the upper visitor center and entrance trail into the main “crater” of Haleakala. The road is very winding, with innumerable curves – especially before reaching the national park.
We did not extensively explore Maui, especially the moist areas on the eastern part of the island – the road to Hana. However, finding natural moist forests on Maui (or on any of the islands) is not simple. All Hawaiian Islands have forest reserves managed by the state of Hawaii. These reserves may include introduced trees and are not managed to be natural landscapes. Hunting is allowed on weekends. The relatively recent Hawaiian State Natural Areas are attempting to protect natural landscapes but these are often closed to public entry.
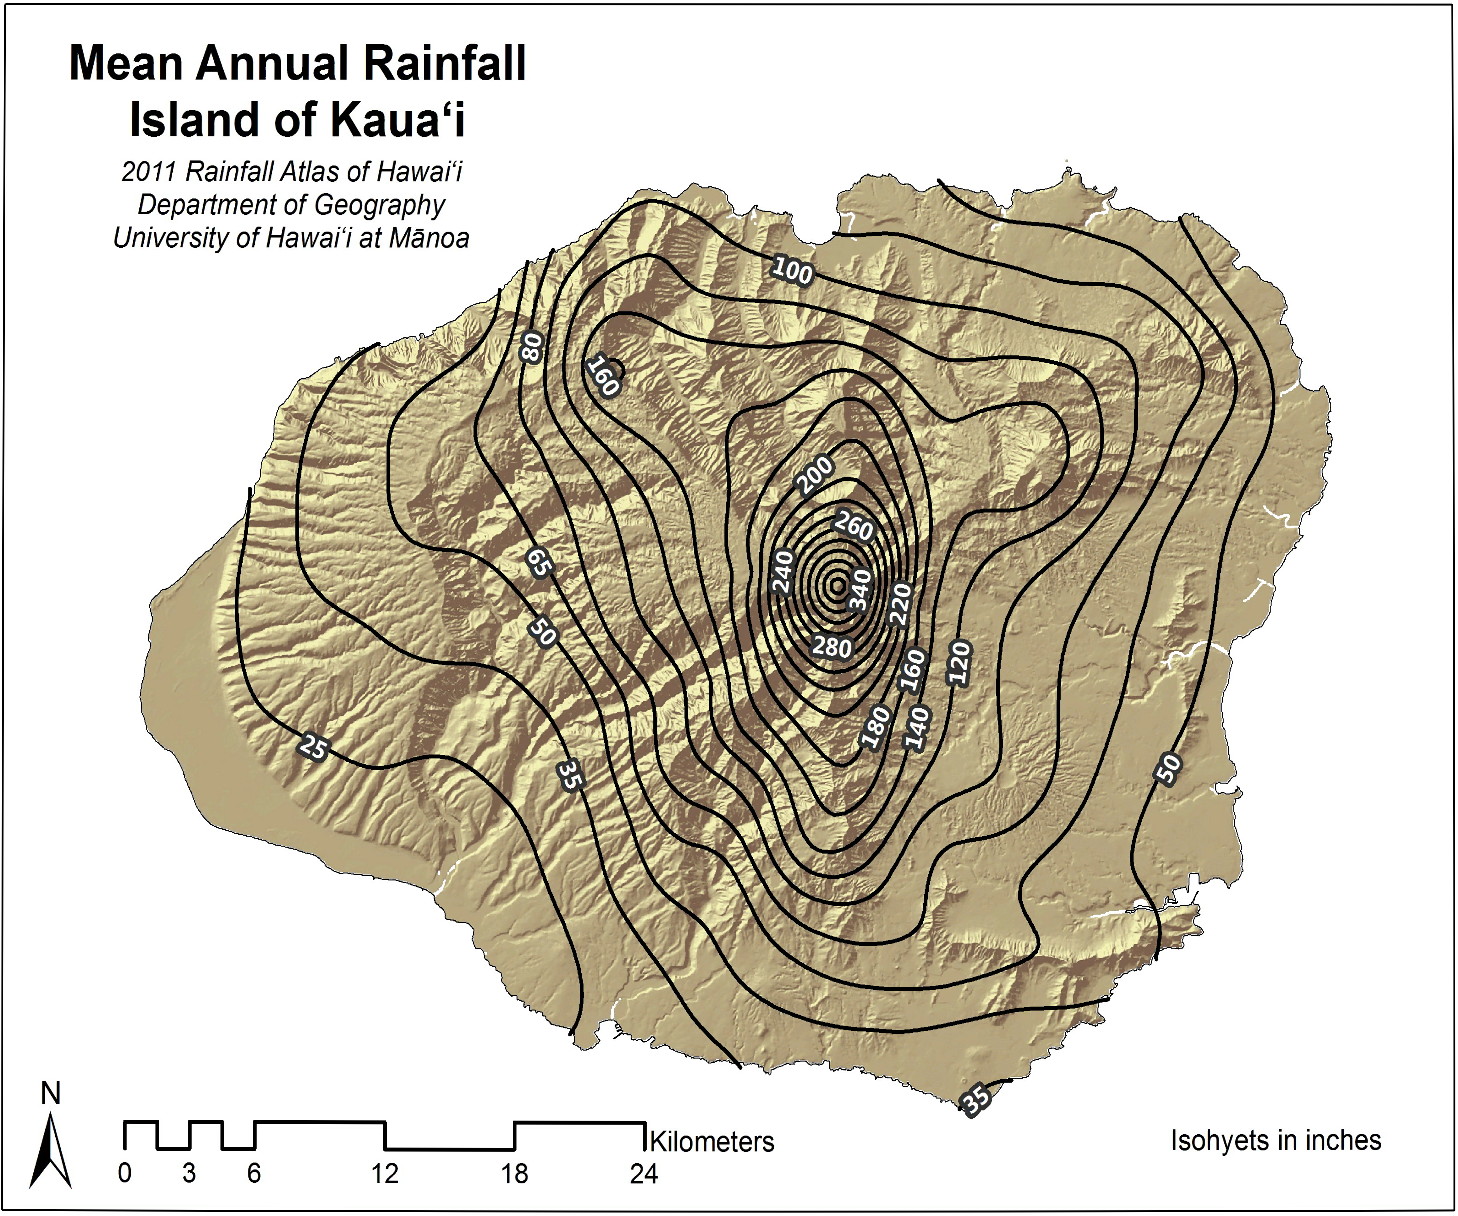
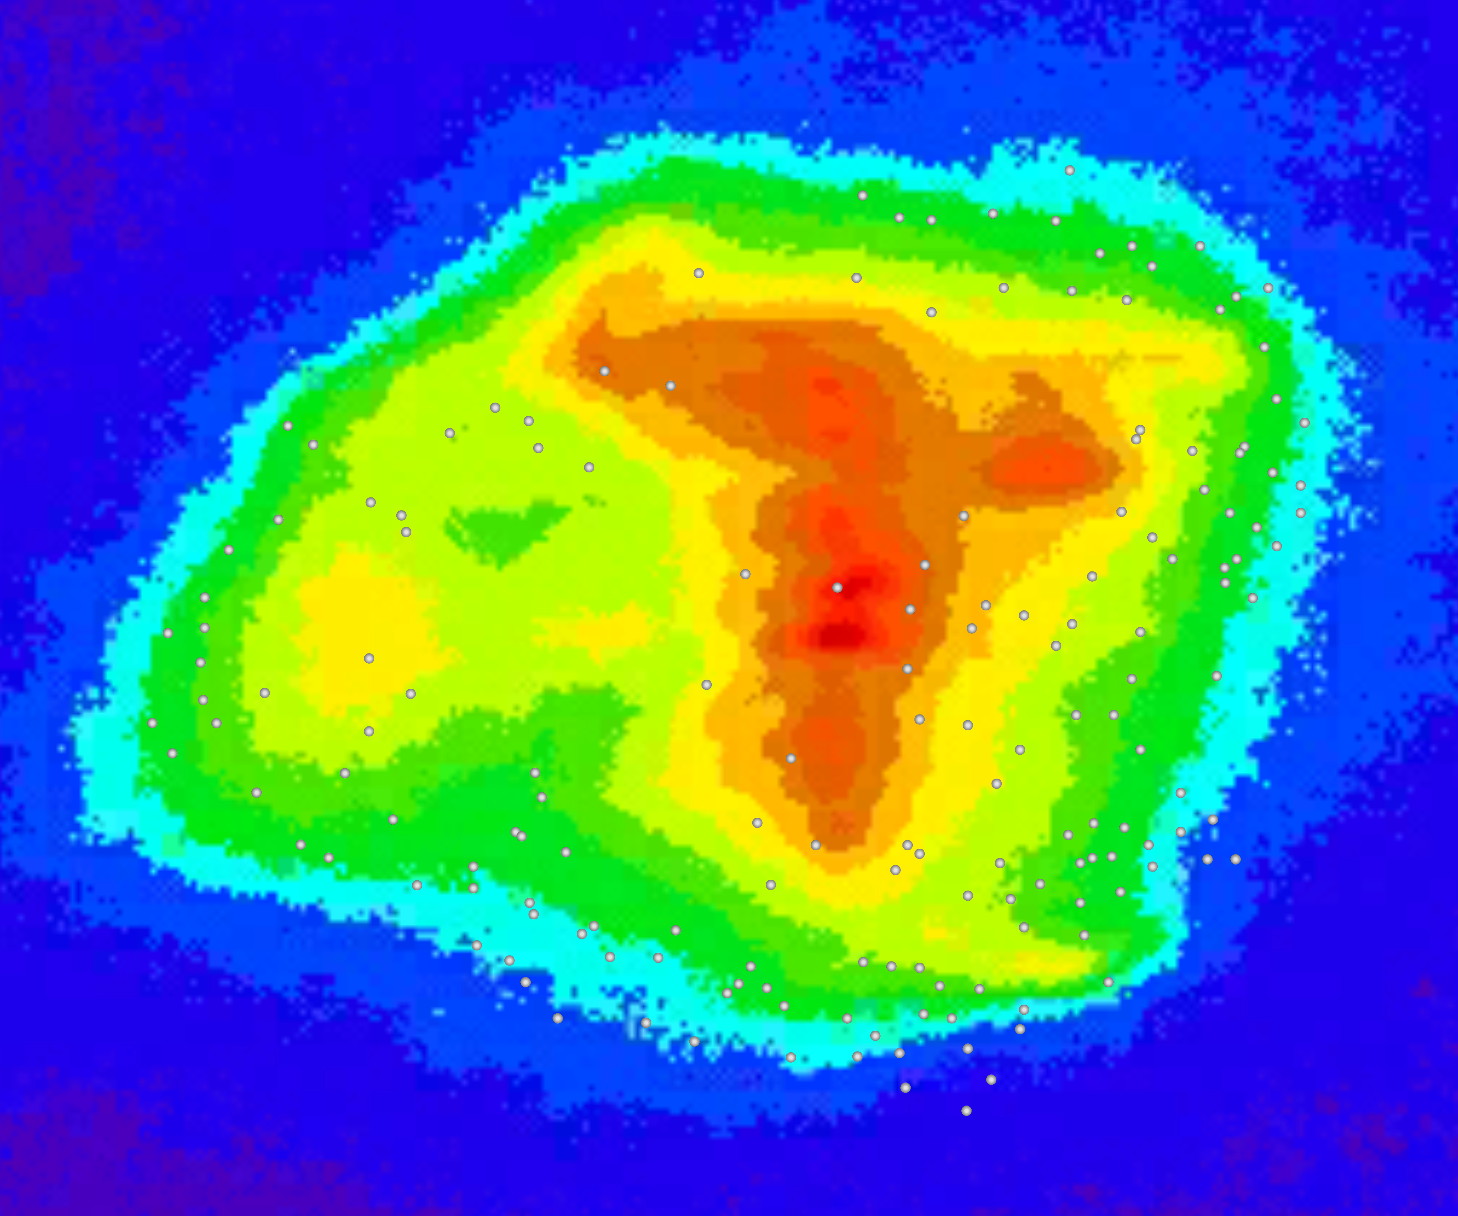
Kauai
Below are rainfall analyses and annual mean cloudiness estimated from satellite for Kauai. The captions explain in more detail each of the images.


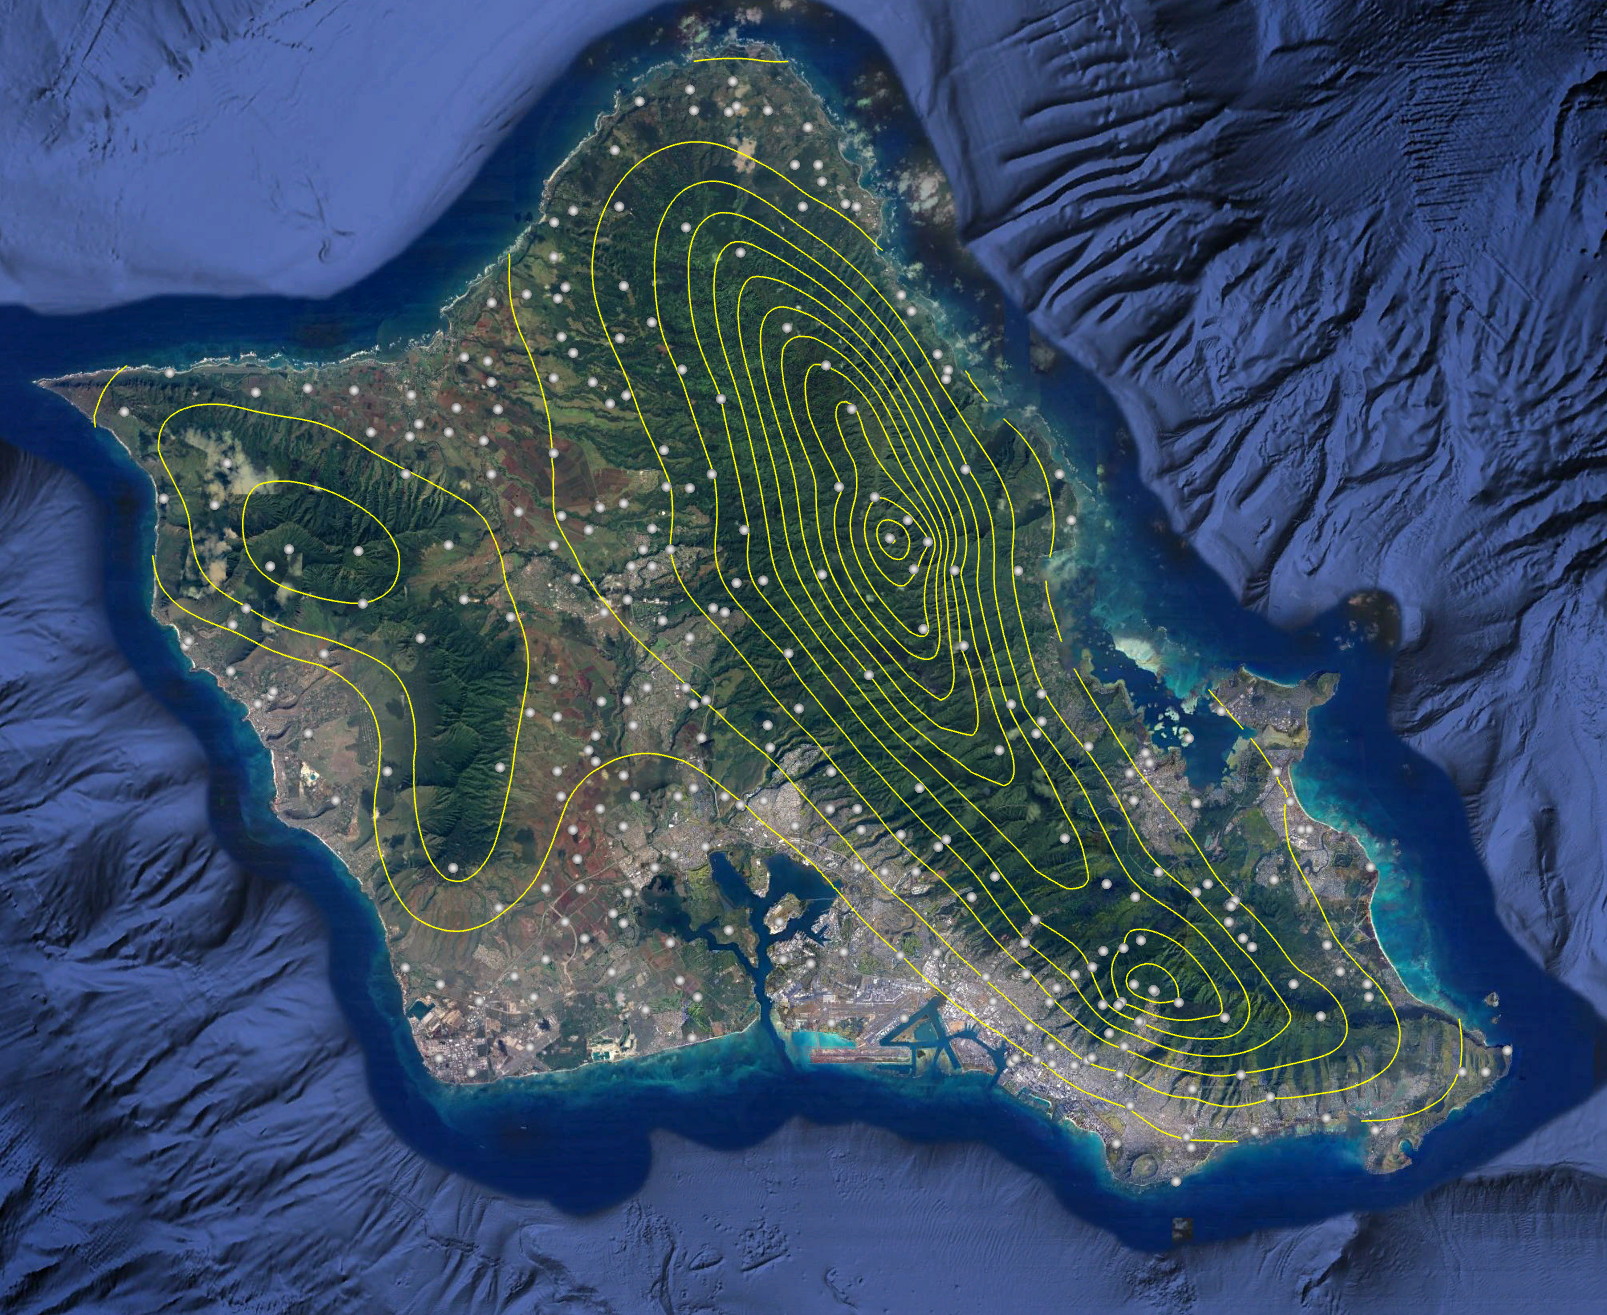
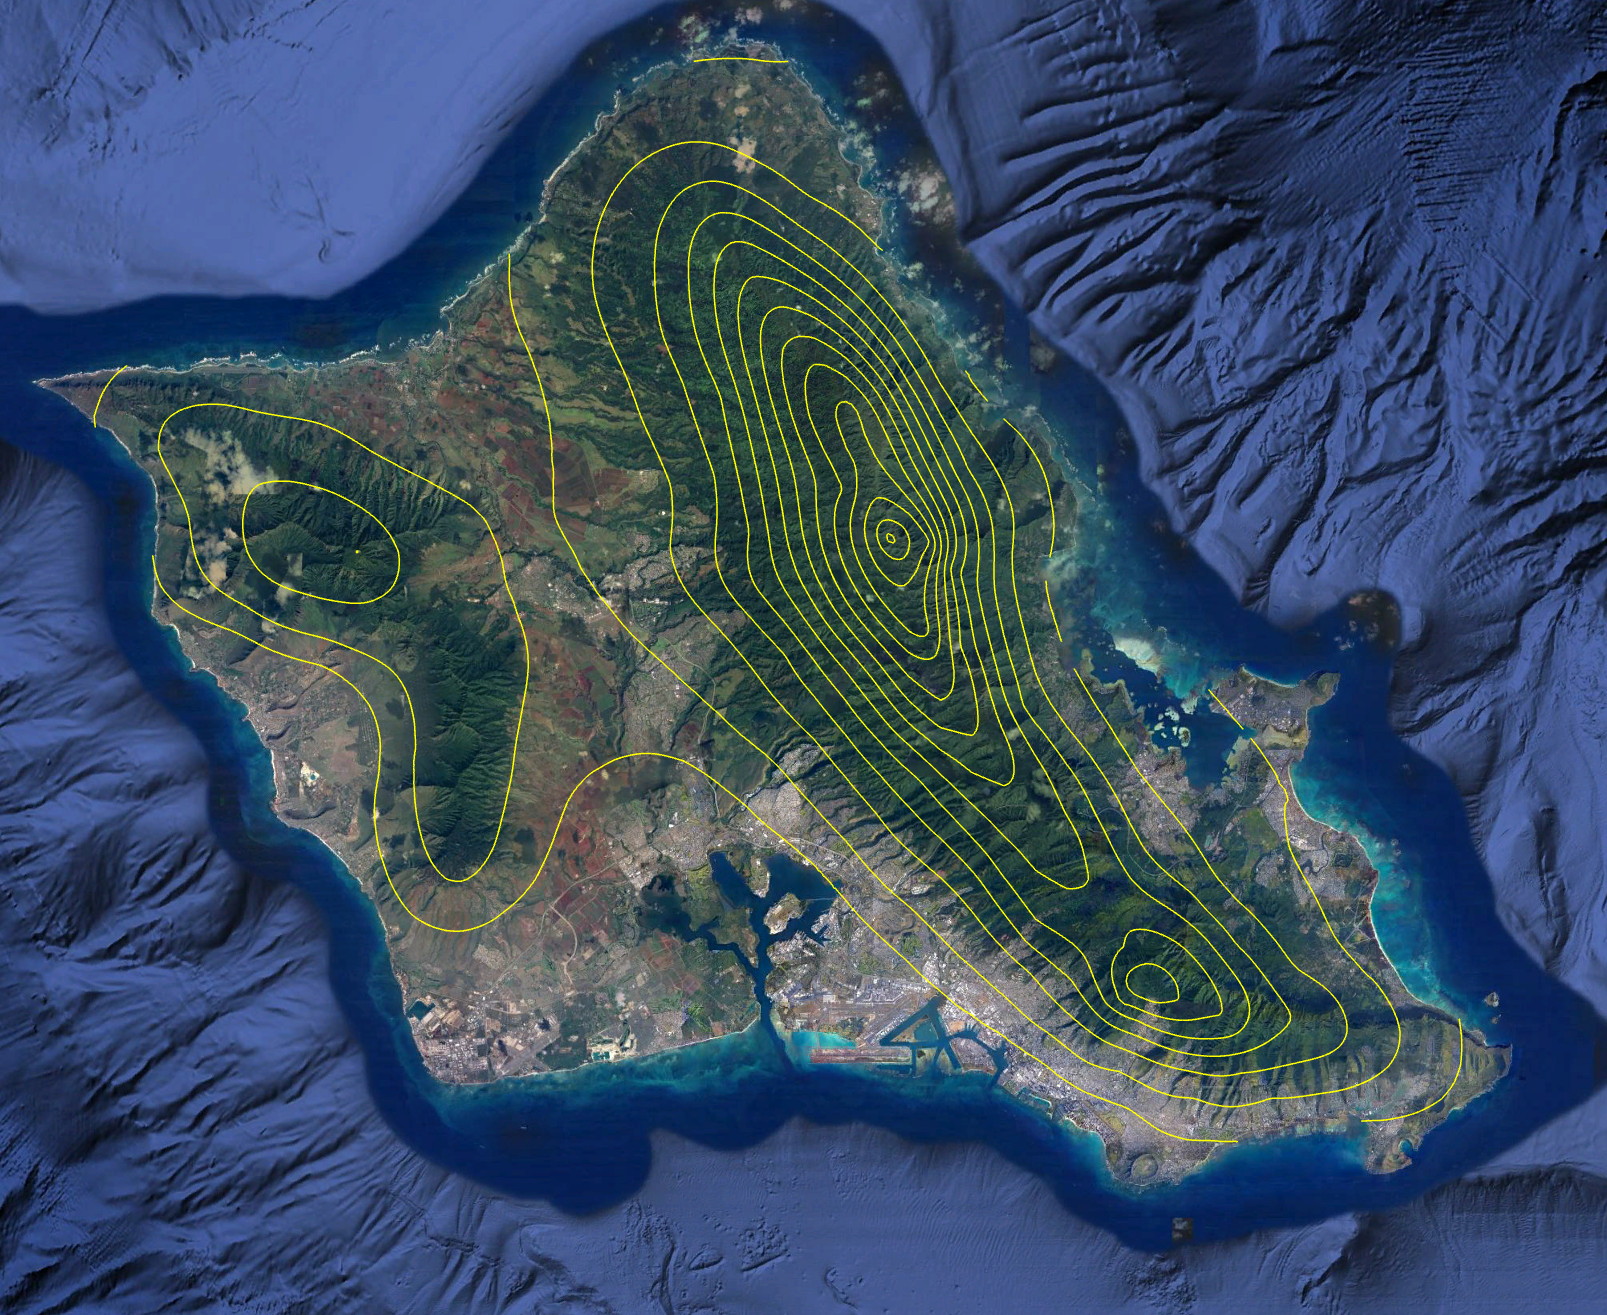
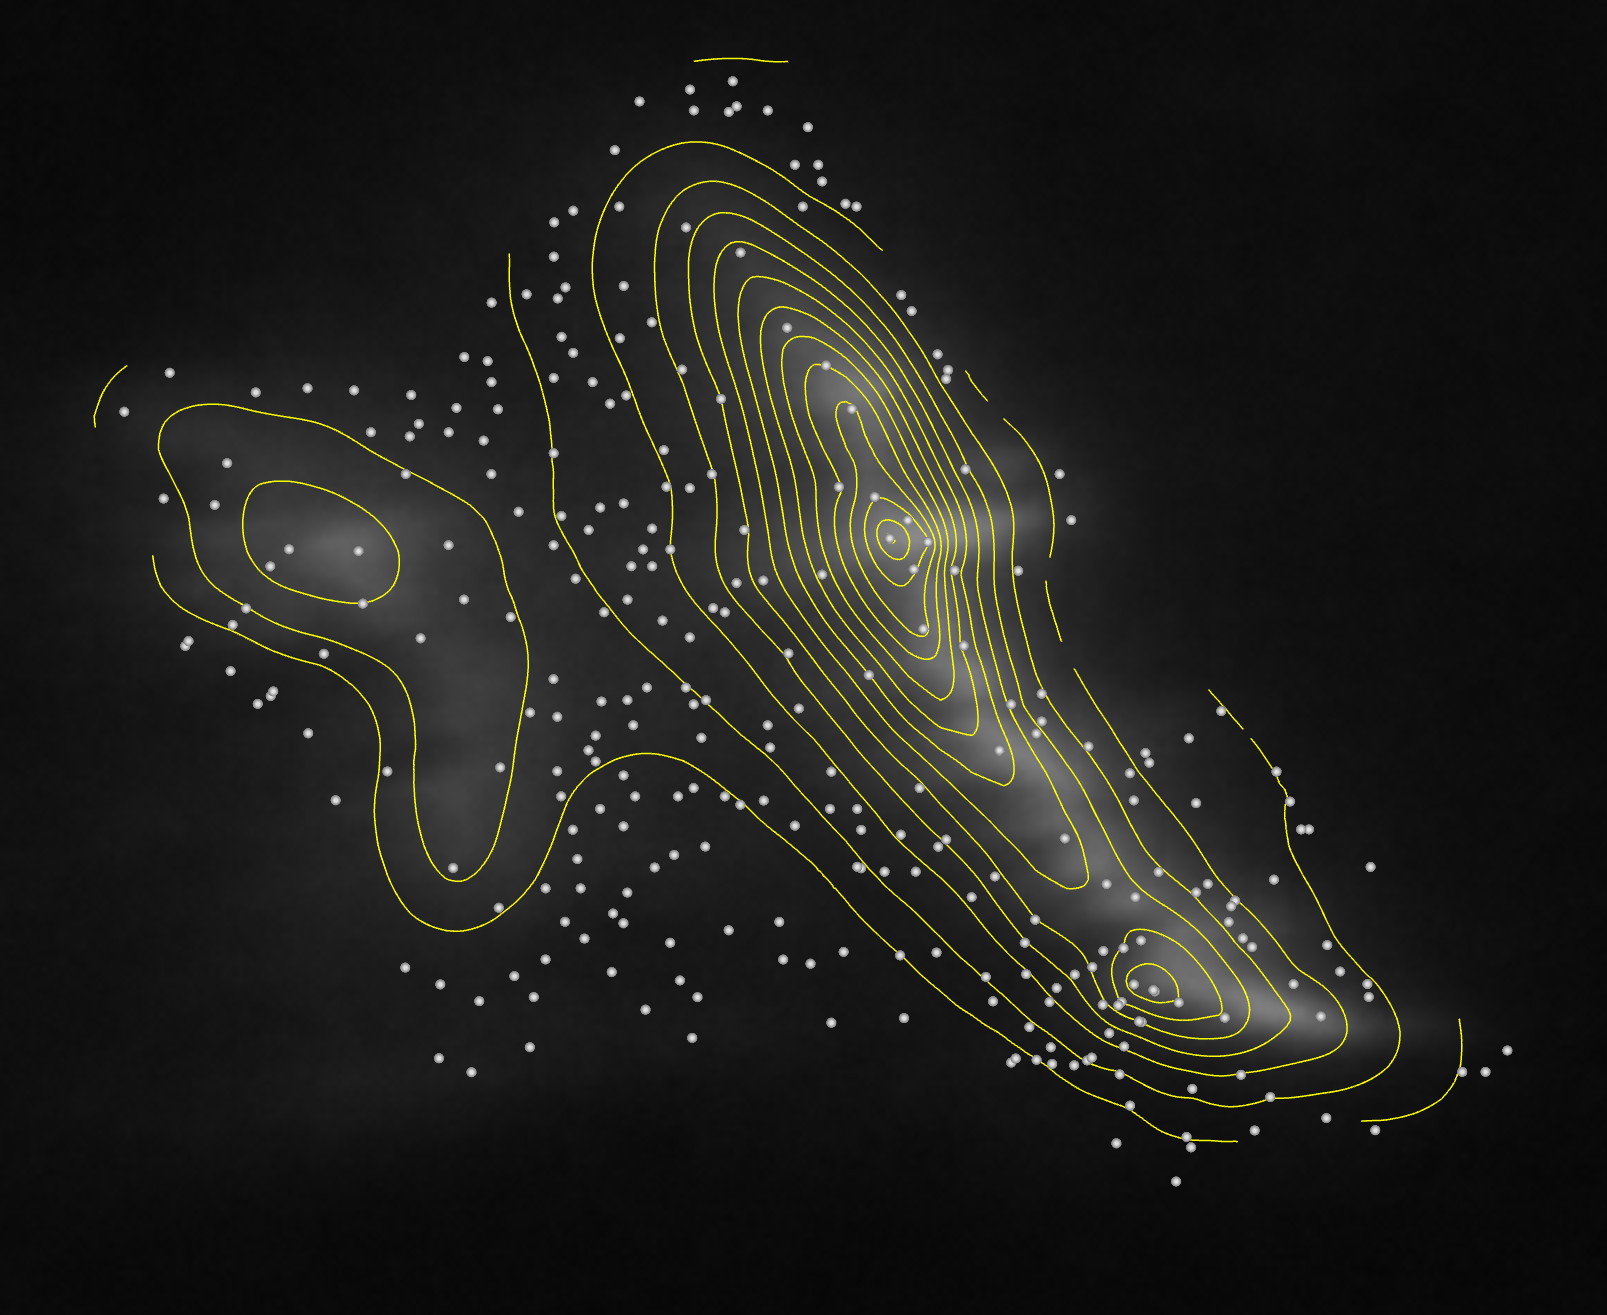
Oahu
Aspects of the climate of Oahu are shown below. Step through the images to see the mean annual rainfall from the Rainfall Atlas of Hawaii as well as satellite and shaded relief depictions of the island. The figure captions explain in more detail each image.