This page is an effort to put some recent satellite imagery composite “work” in a place I can show to potentially interested people. I say “work” because this isn’t real “paid” work, just things I play around with in my spare time being “retired”. I know some of you will say “get a life – you’re retired!” but it’s a by-product of working as a scientist for so long. Ideas keep coming up…things to look at… before you get too old to look at anything.
The objective of what follows on this page is to see whether cloud climatologies based on LANDSAT-type imagery (in this case from the Sentinel 2 satellite) that has 30m resolution can produce better climatologies in areas of rough topography than even MODIS imagery (with 250-500m resolution). The Sentinel imagery repeats every 5 days, so one gets only about 70 images in a year and I had only just over two years available in easy to access format from an online source. So the first question is whether two years of imagery, every 5 days, gives you a decent climatology. Many people would say no…but let’s see from the results below.
What’s the point of all this? Well, the occurrence of plants and animals is well-known to be closely related to the climatic conditions. And if cloudiness (especially in the tropics) is strongly modulated by the detailed topography, then more detailed cloud climatologies could be important to estimating where plants (and associated animals) might live. In a nutshell, we want the best climatologies for producing the best mapping of where life on Earth lives.
Another reason for developing these climatologies is to see how cloudiness patterns change as islands evolve over geologic time. Volcanic islands start small, then grow (usually symmetrically) and then when active volcanism stops the islands erode gradually. The older, more eroded islands will have more available niches than the younger symmetrical islands. This is generally recognized. What I am trying to show is that the eroded islands, through their more irregular topography, also modify the resultant cloudiness patterns in the mean and thus may have more complicated cloud (or precipitation or fog drip) climatologies.
To do the above requires looking at detailed cloud climatologies of many islands in their various stages of decay. And then somehow generalizing the results….
The previous paragraph is how I would justify the work to other biogeography-types. But I actually am just curious about these details – independent of whether it is justifiable or not. I find all kinds of patterns in nature very interesting.
All of the results shown below are made by downloading the true color imagery (Sentinel or MODIS), converting them to grayscale images, and then selecting pixels greater than a certain brightness threshold (typically 170 or 215 out of 255 grayscale values: 0=black, 255 -s pure white). Averaging these cloudy pixels produces the results shown. The more imagery available, the smoother the results. Sentinel imagery available from the website I used (https://worldview.earthdata.nasa.gov/) was only available from 2017 onward. Imagery repeats every 5 days, but many days were missing or incomplete. I have used only complete imagery in the means shown here.
The thresholding procedure here doesn’t work well with snowy areas, or where the land surface is very bright (e.g. high albedo deserts). One sees the coastlines in some of the results below (as well as bright urban areas); the coastlines are a reflection of the bright surf zone around many islands. The 30m Sentinel imagery resolves these – they typically can’t be seen in the lower resolution 250m MODIS imagery.
Macaronesian 2+ year climatologies from Sentinel 2 imagery
Macaronesia refers to the islands in the North Atlantic – typically belonging to the Azores, Madeira, Canary and Cape Verde Archipelagos. They have certain similarities in terns of their geologic origin and biota.
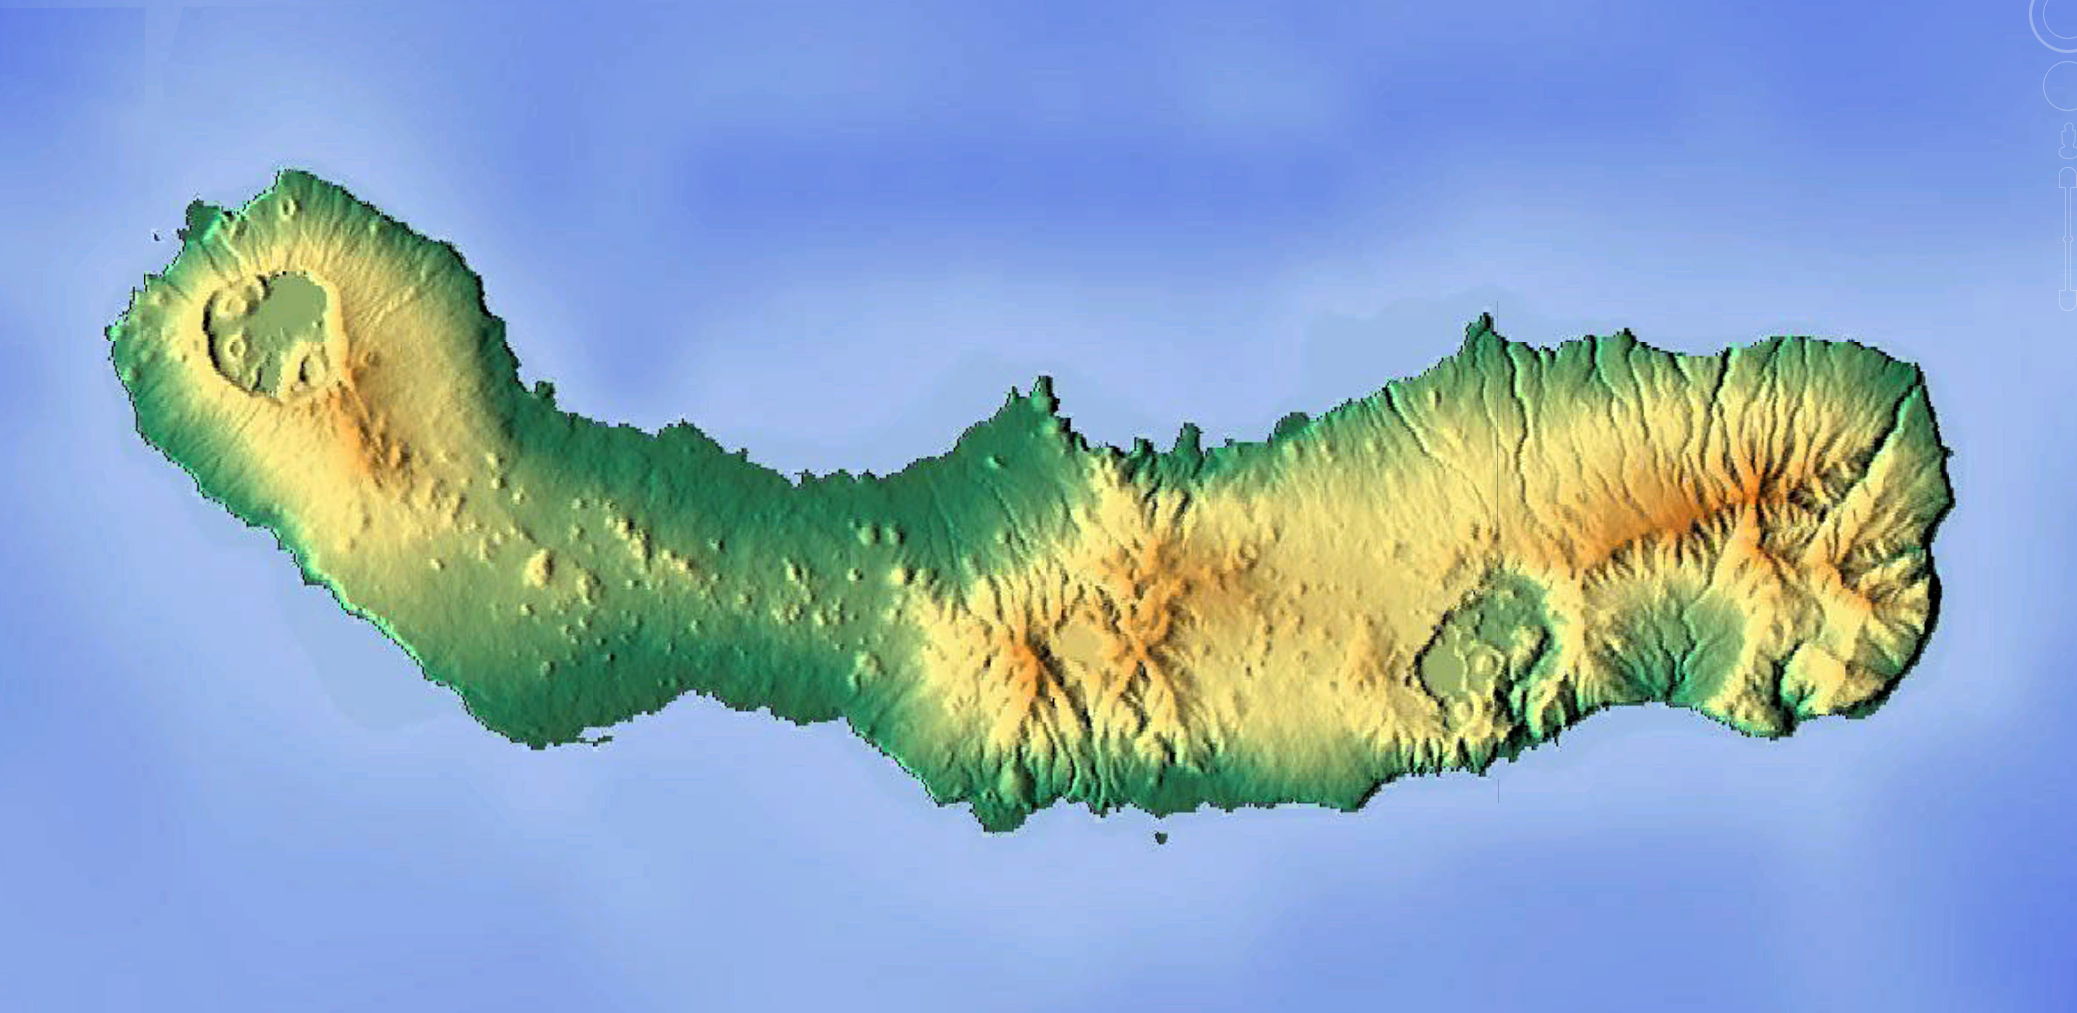
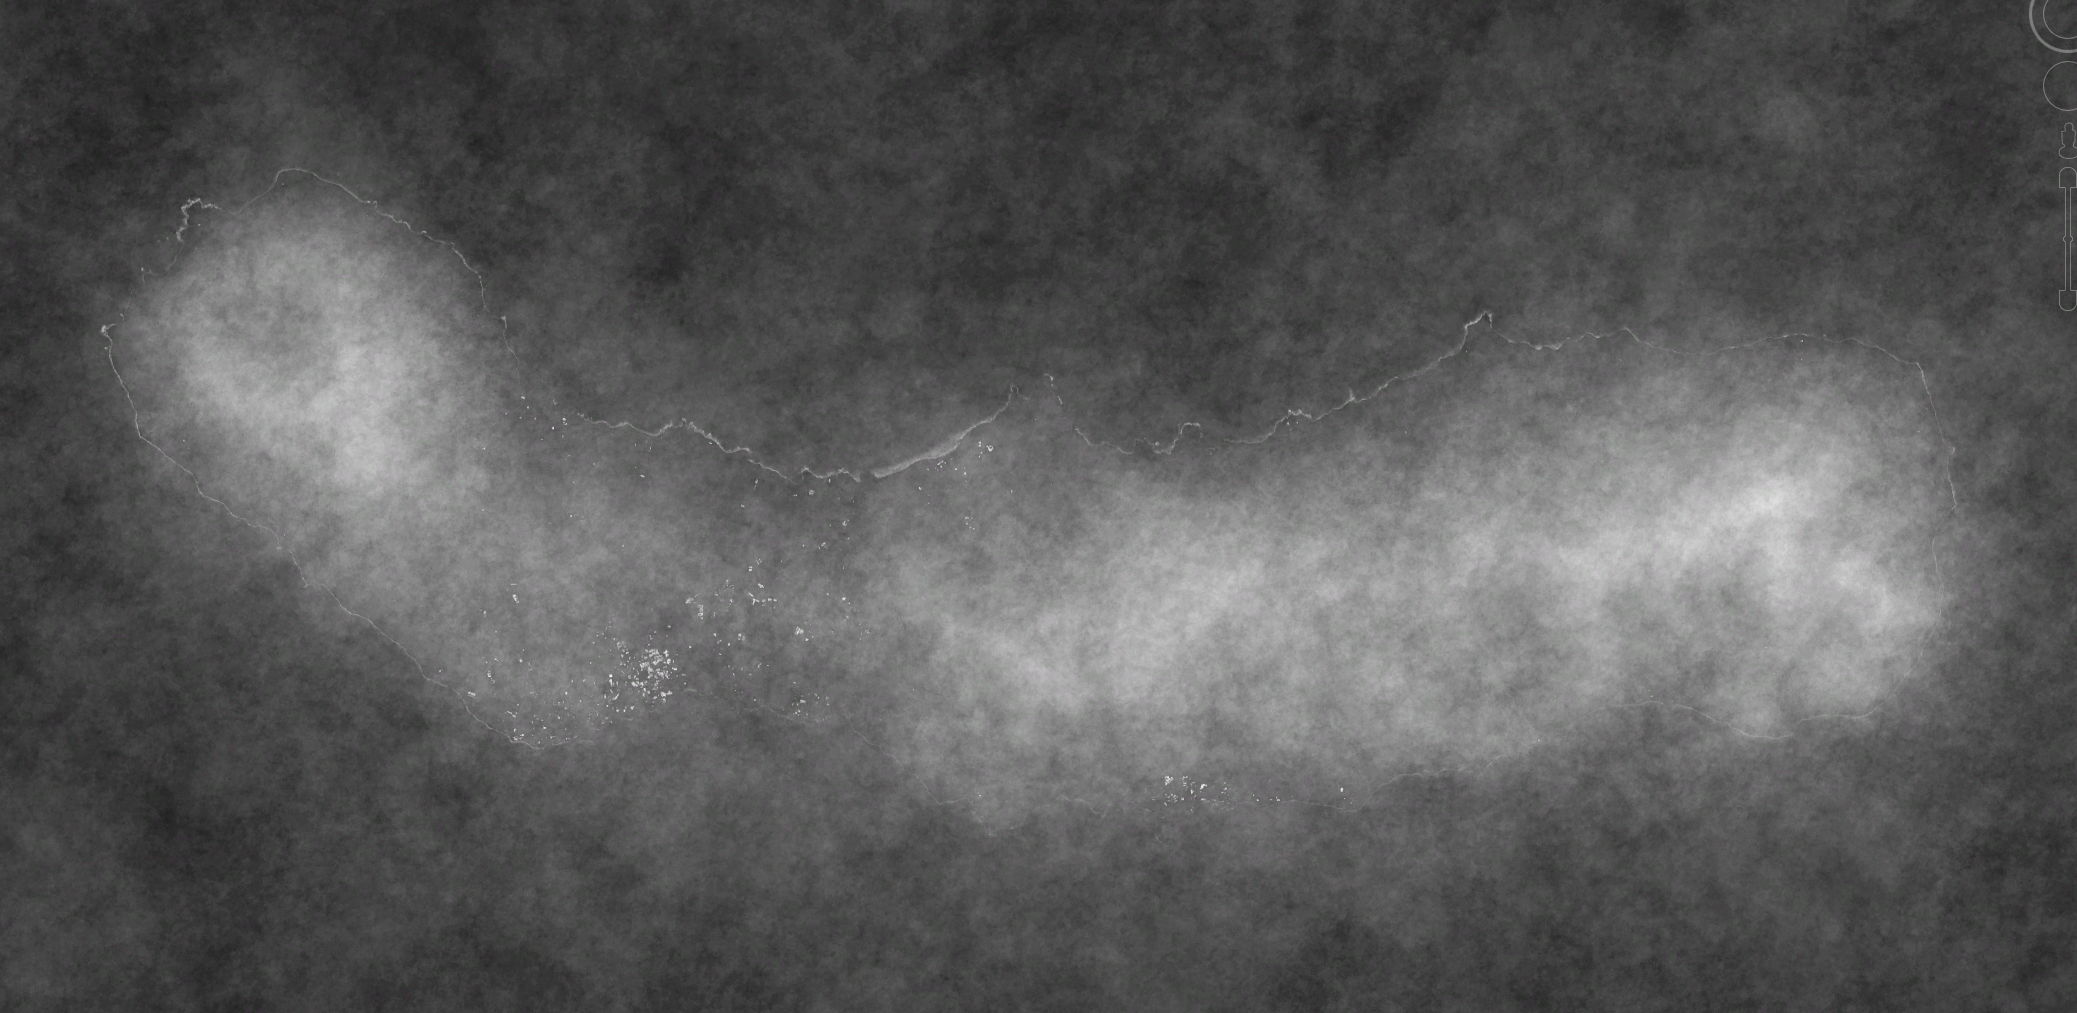
A) Sao Miguel Island (Azores) relief and cloud frequency (brighter is more cloudiness, darker is less). Coastline appears in cloudiness image because 30m resolution of Sentinel resolves the breaking waves along some shorelines. Cloud detection procedure identifies pixels brighter than 170 (out of 255 grayscale). Sao Miguel is about 63 km E-W. Mean cloudiness is based on 117 Sentinel-2 30m resolution images.

B) Select western Azores islands (scene is about 180km across) showing relief and mean cloudiness from Sentinel imagery. Mean cloudiness is based on 106 Sentinel-2 60m resolution images.
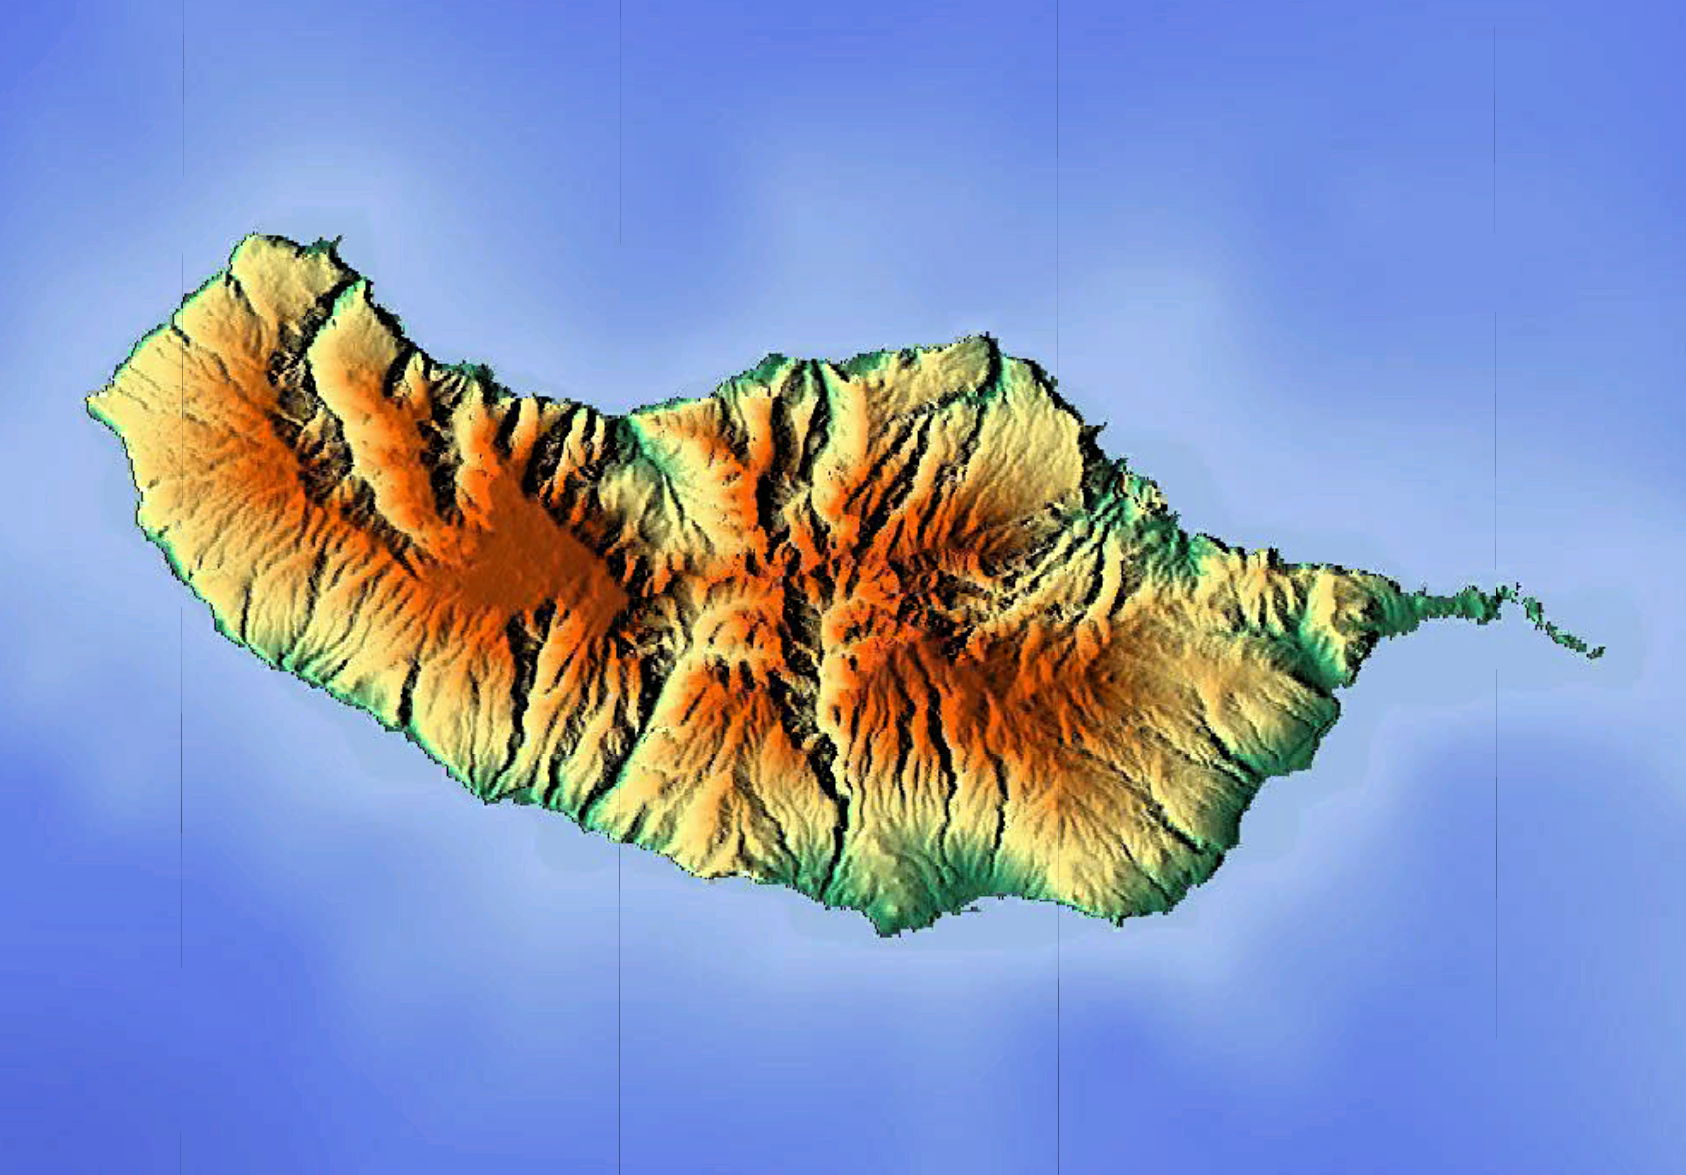
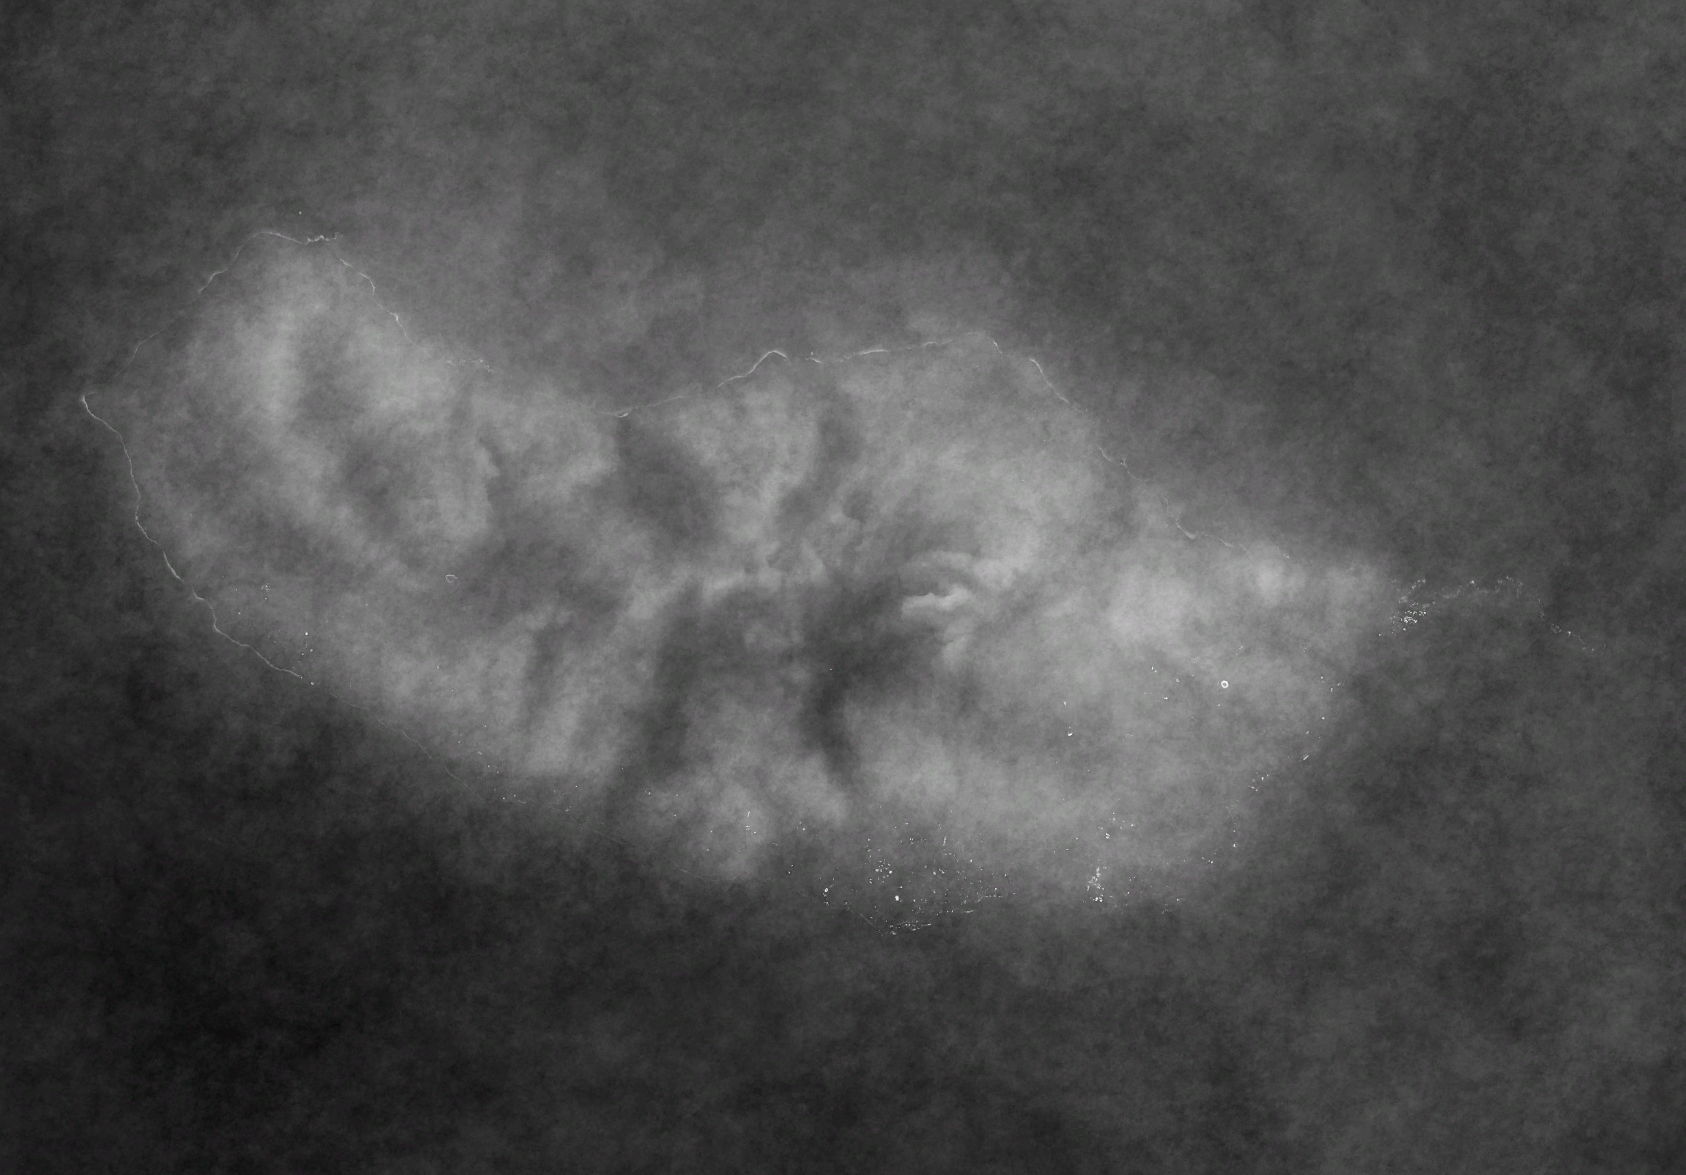
C) Madeira (~57 km across island) relief and mean cloudiness, as in A). Mean cloudiness is based on 136 Sentinel-2 30m resolution images.


D) La Palma (~45 km N-S) in the Canary Islands, as in A). Mean cloudiness is based on 116 Sentinel-2 30m resolution images.


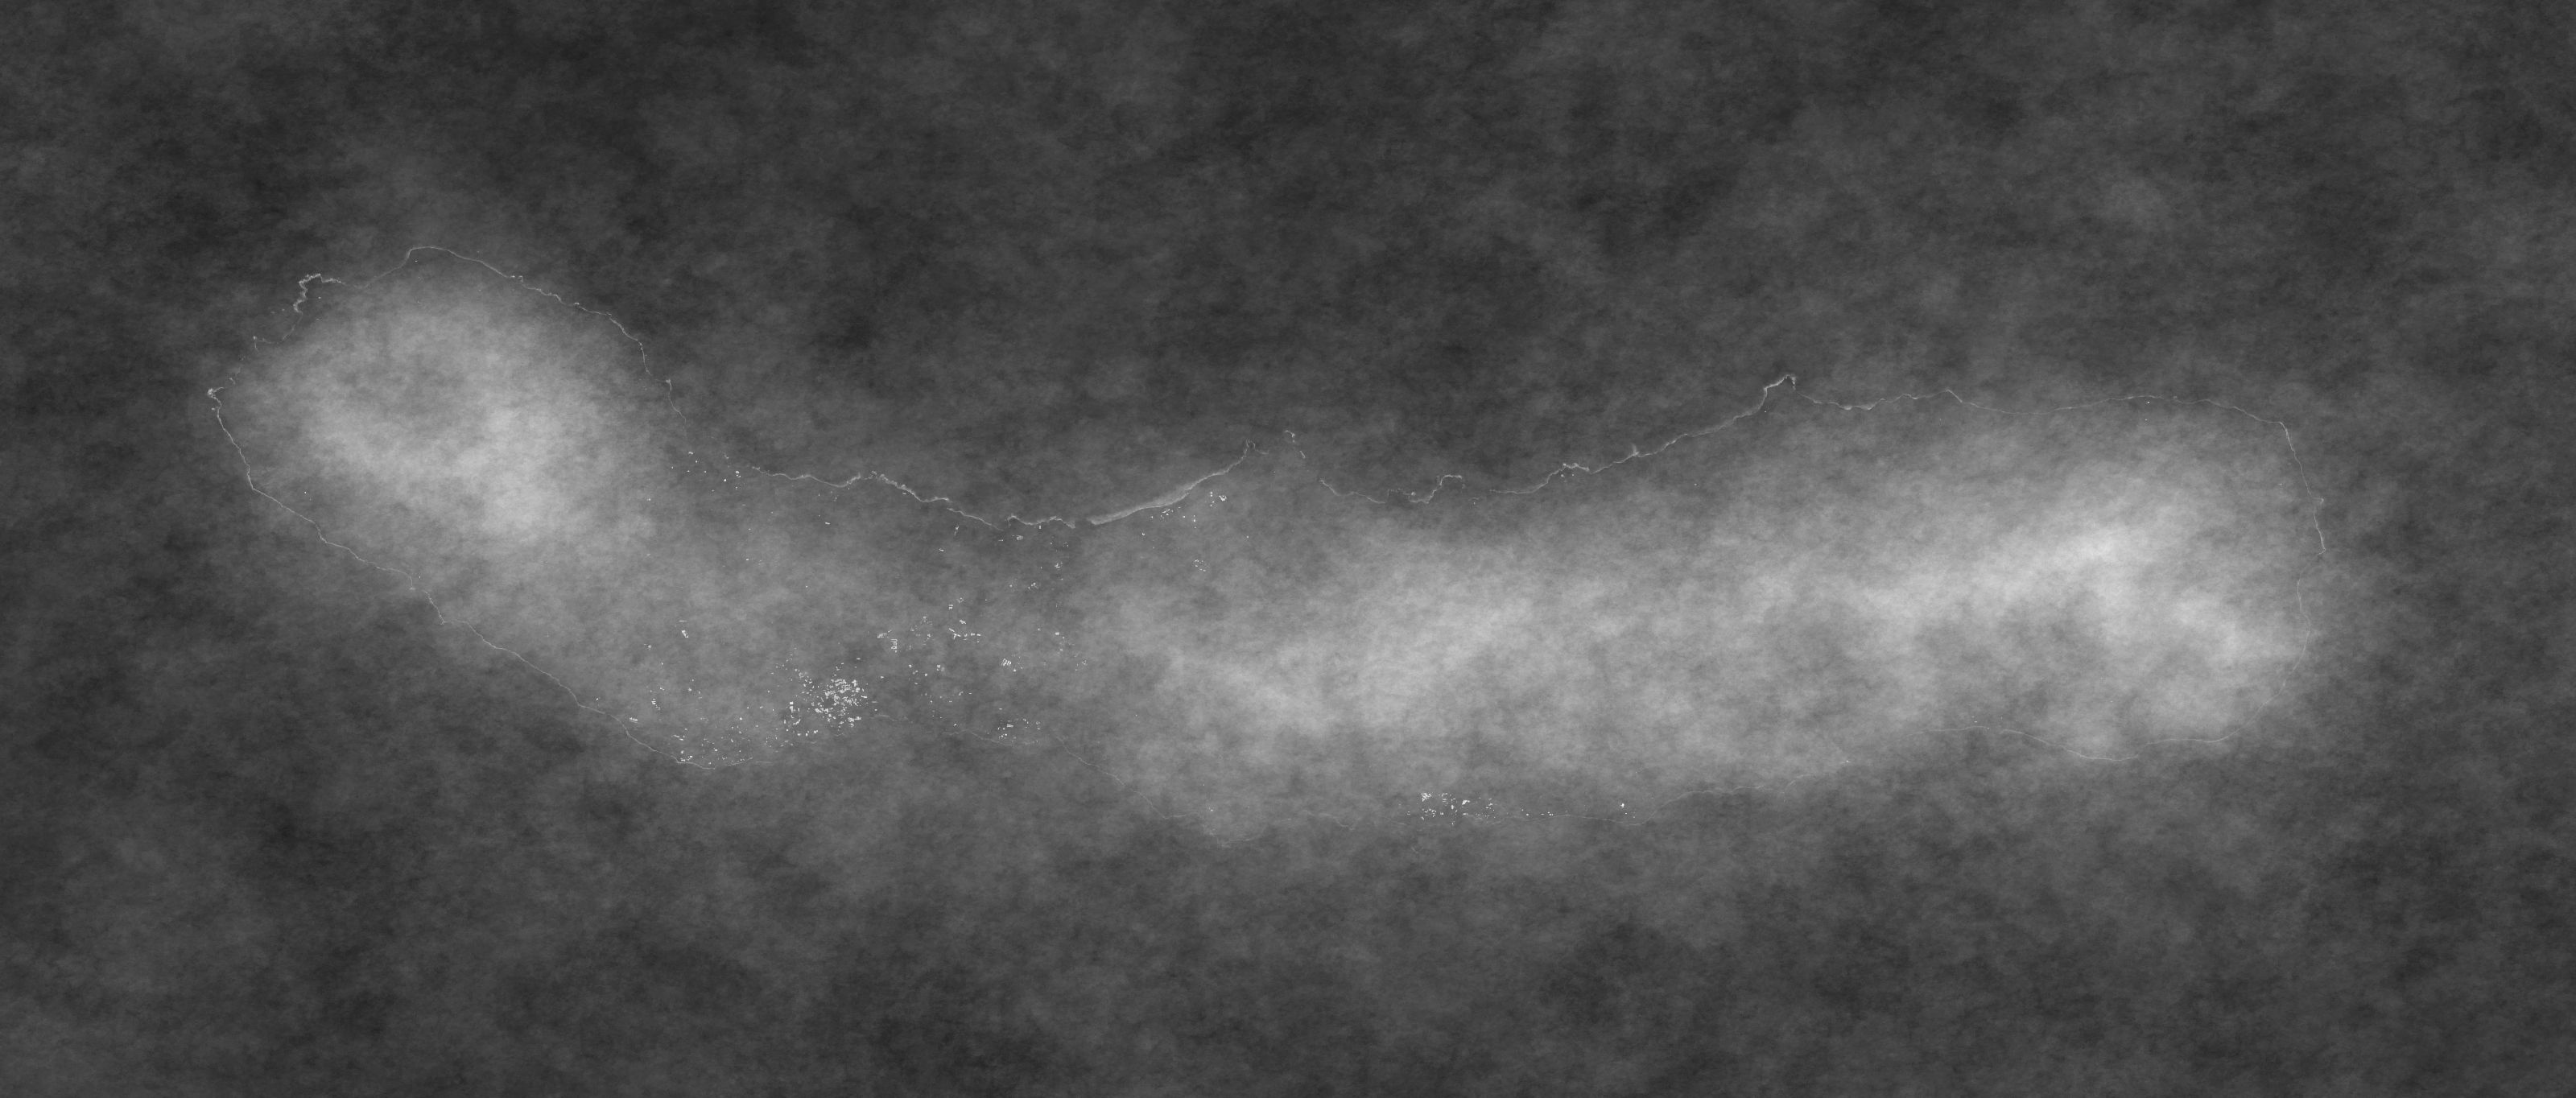
Reunion Island in the south Indian Ocean. Elevations reach ~3 km on Reunion. The distance across the island (NW-SE) is about 70km. Mean cloudiness is based on 135 Sentinel-2 30m resolution images.
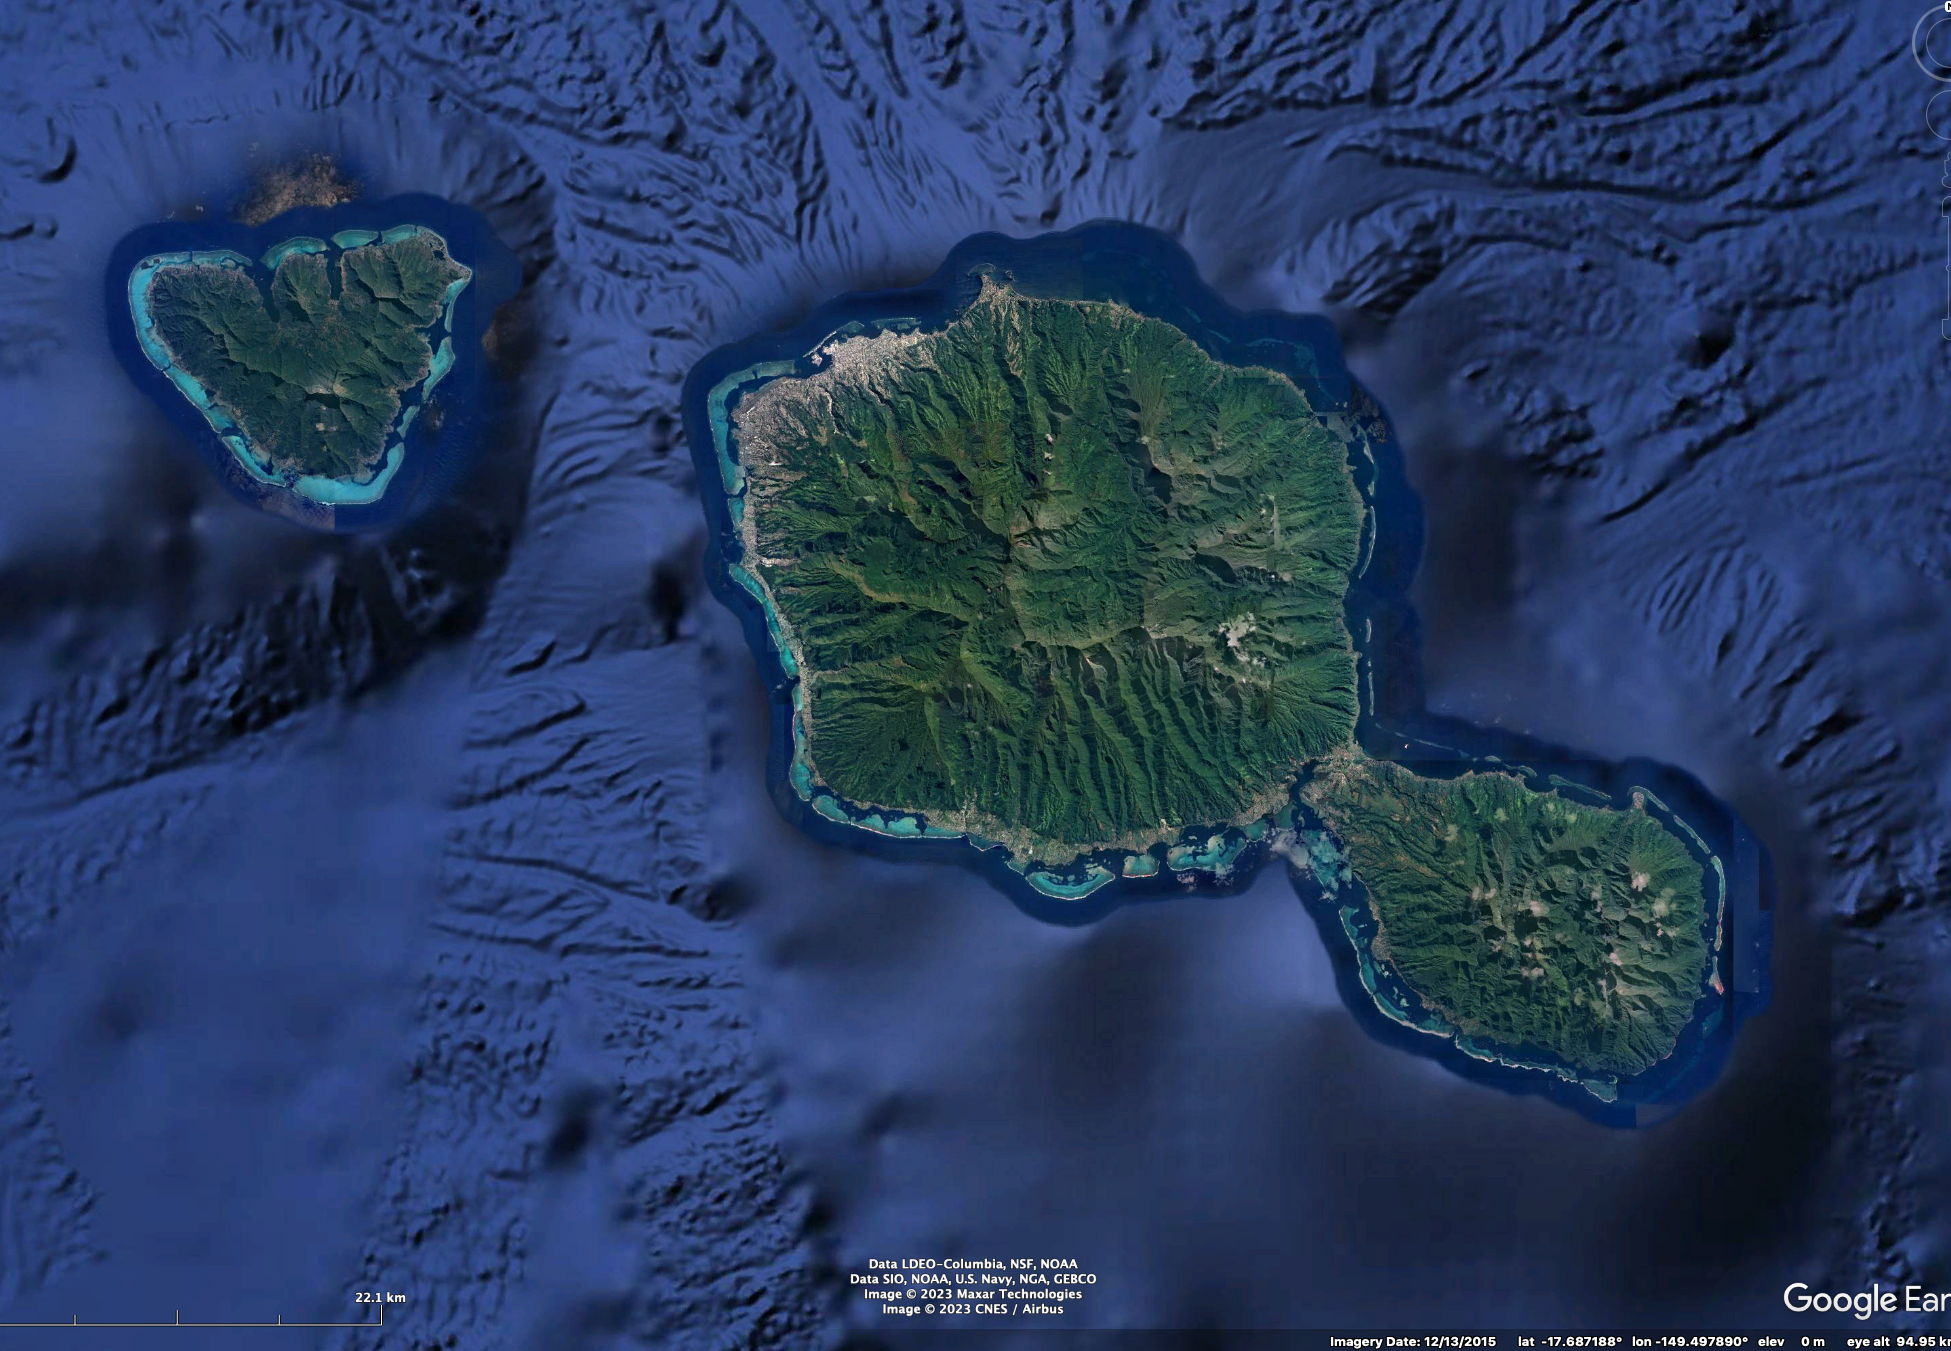

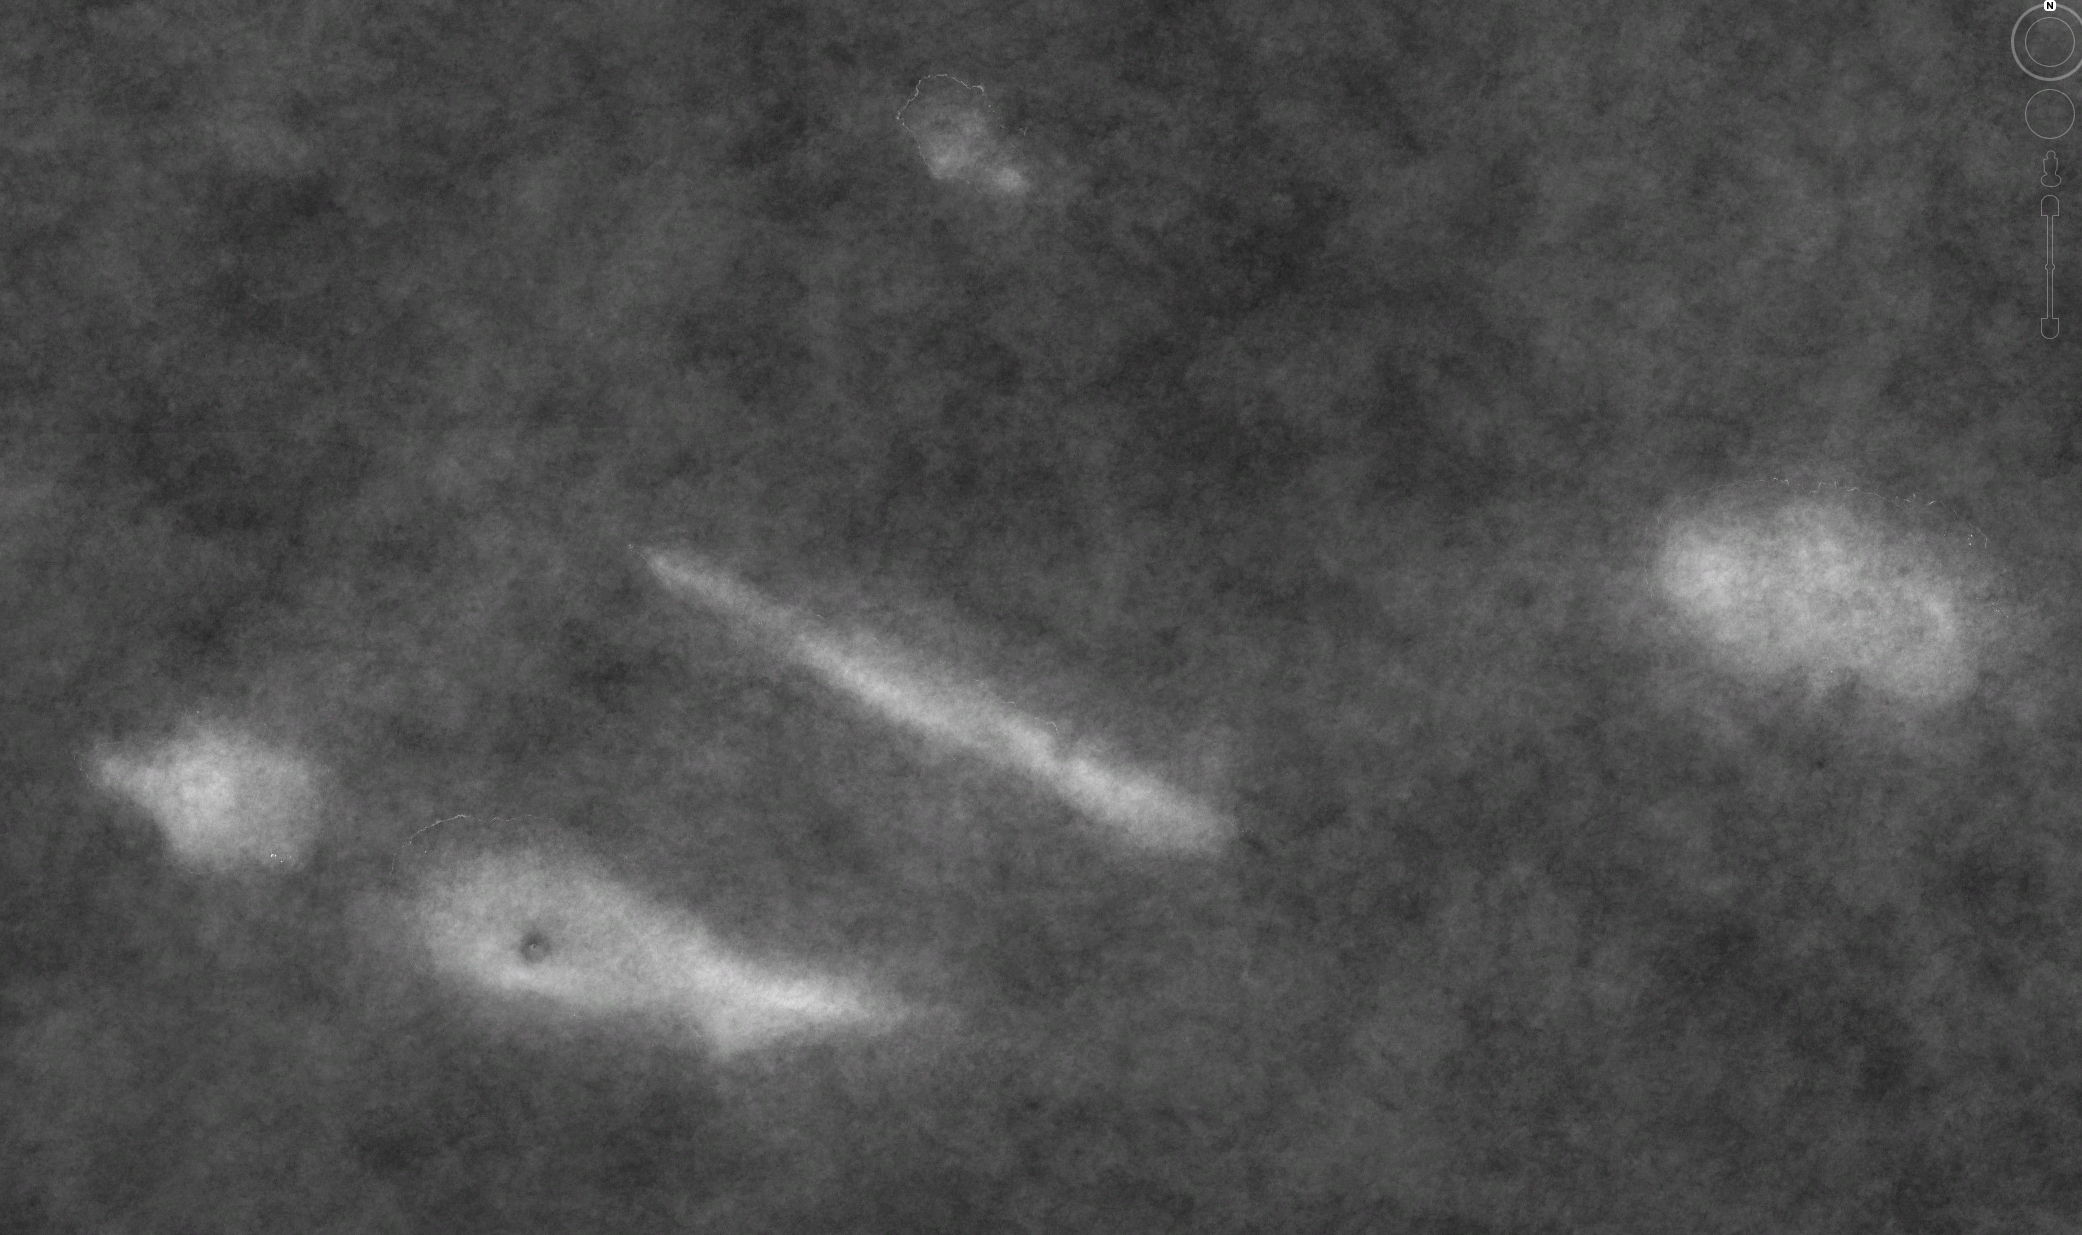
Tahiti (right) and Moorea (left), as in A). Mean cloudiness is based on 117 Sentinel-2 30m resolution images. Graphic scale is in lower left.
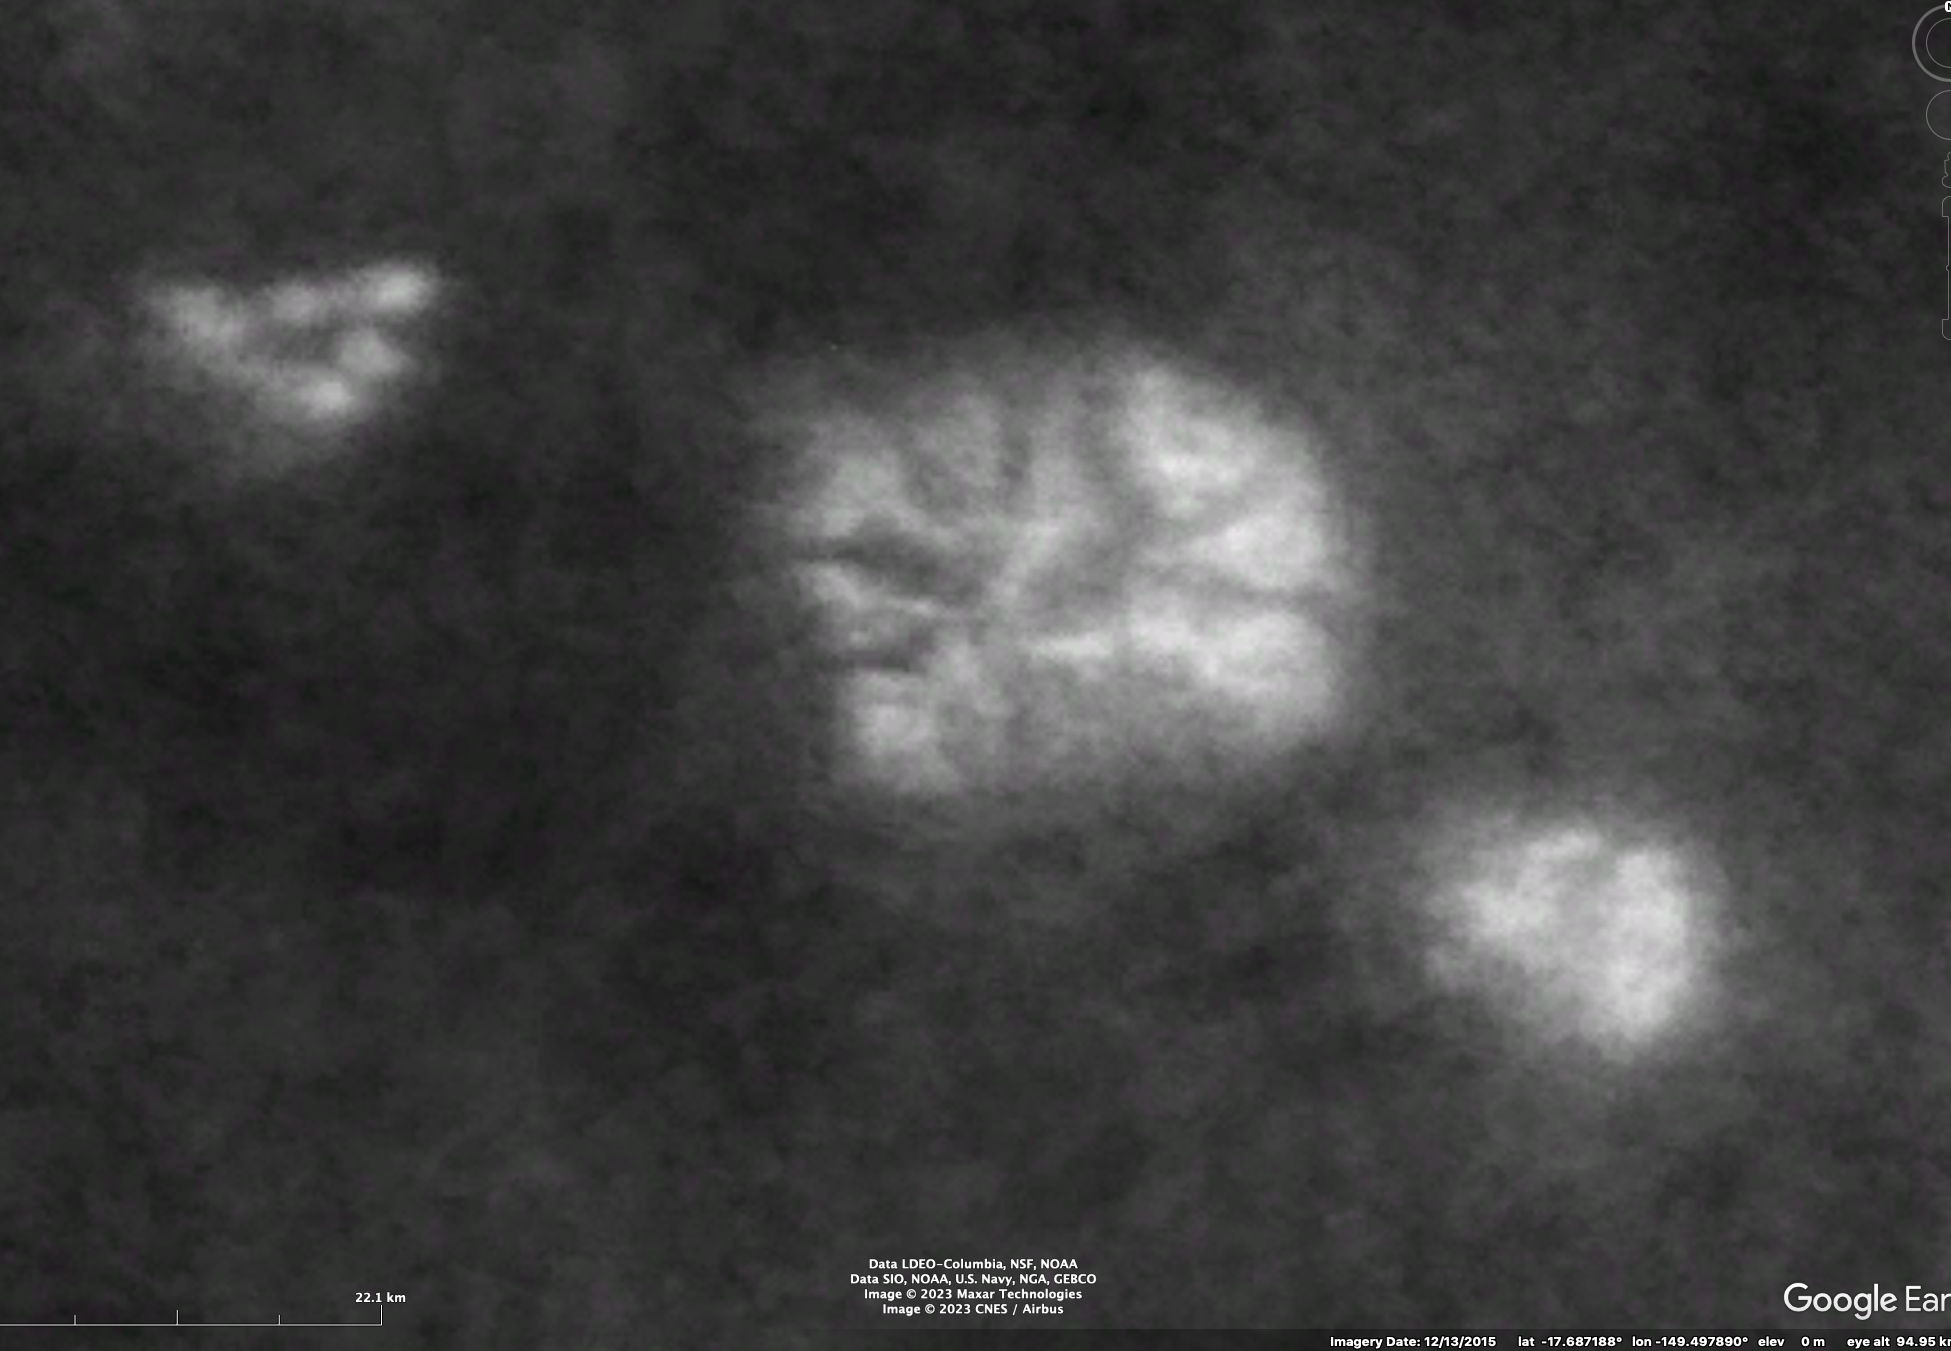
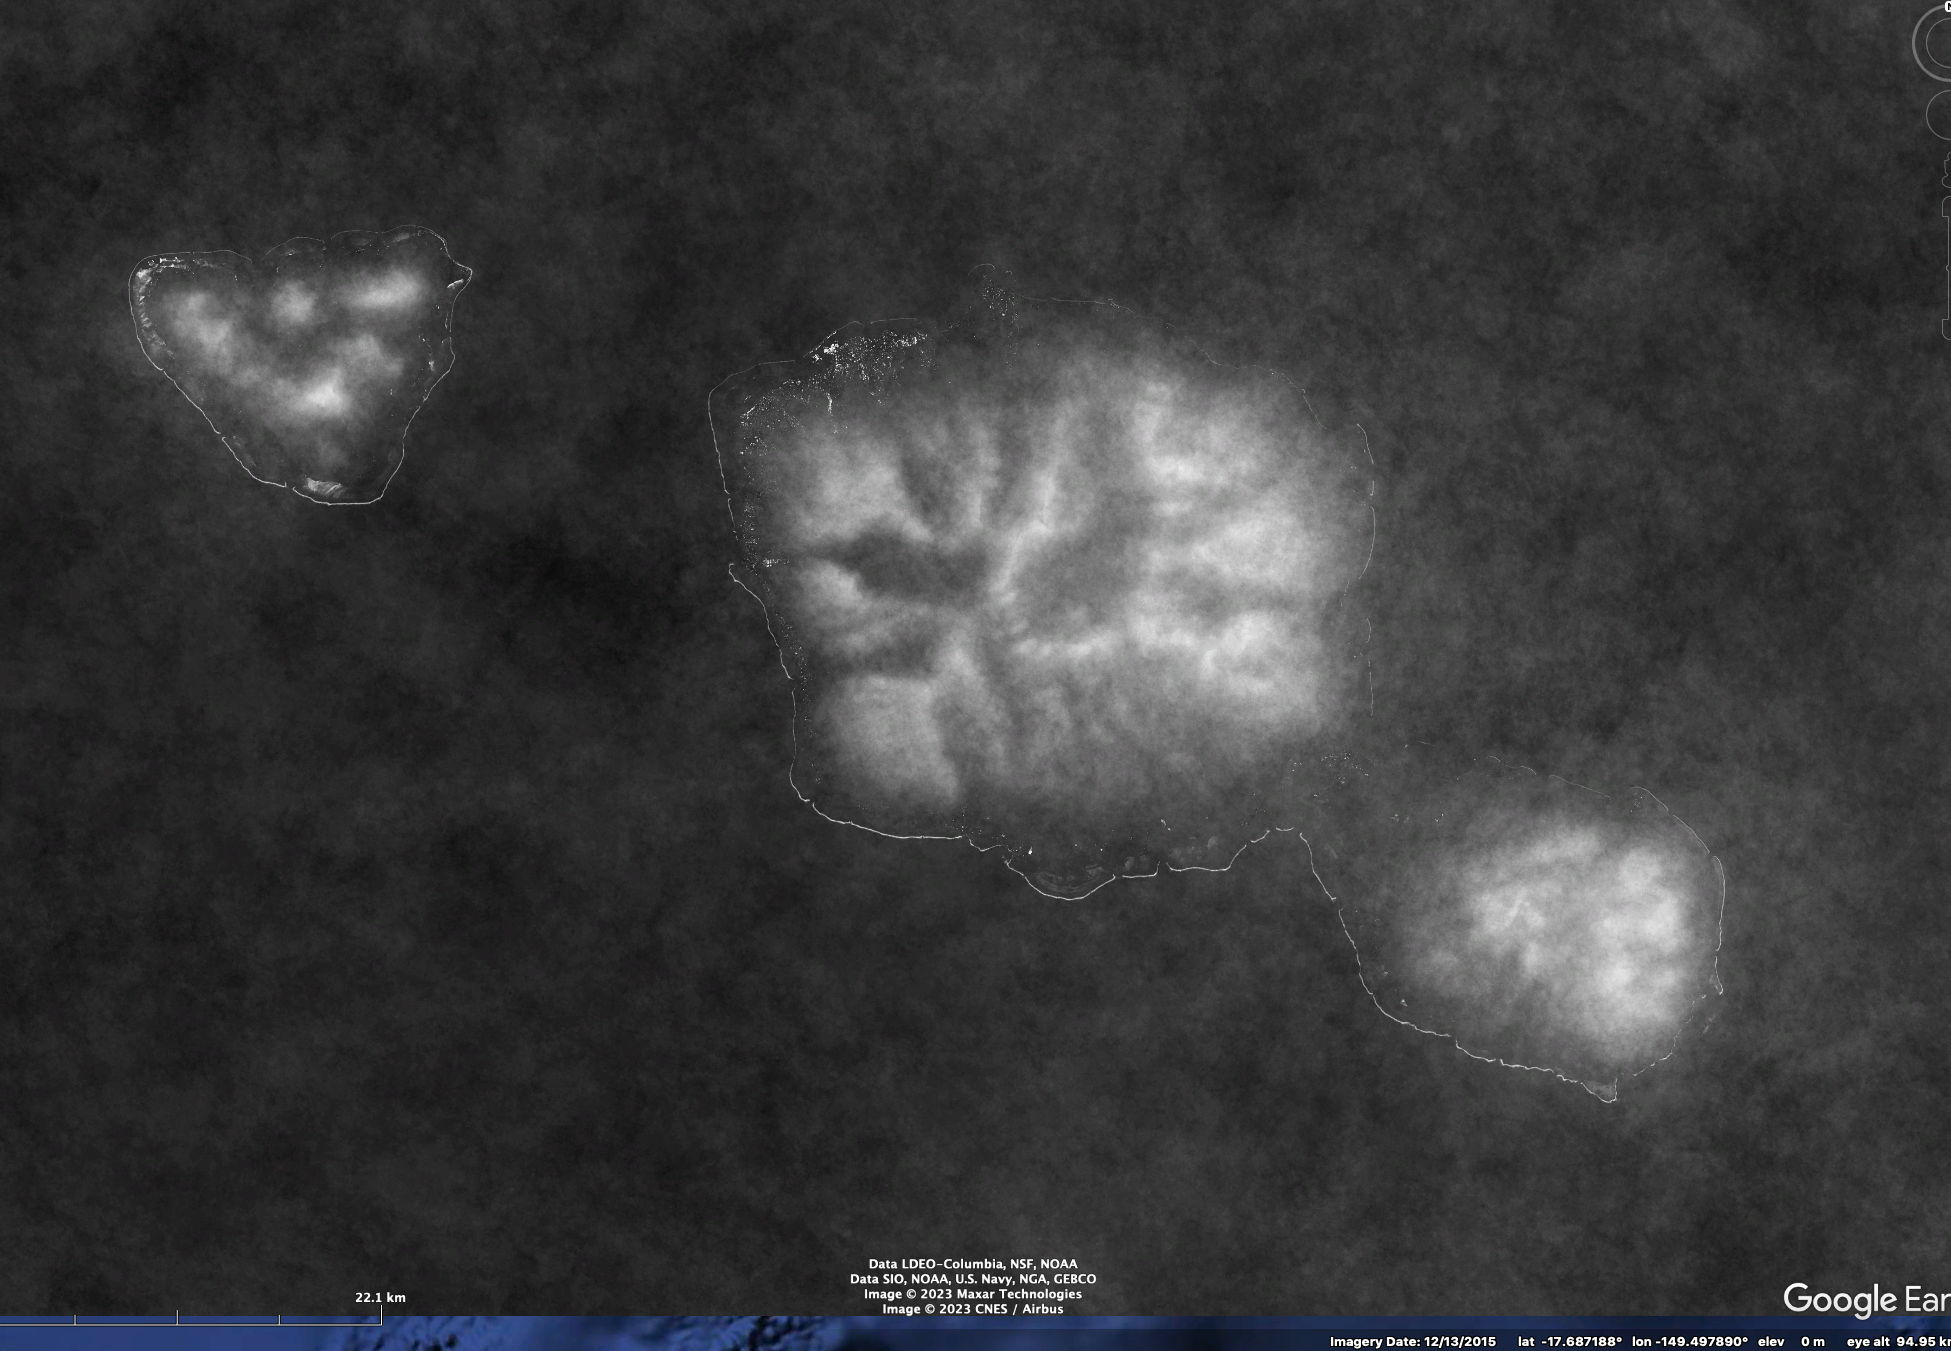
Comparison of MODIS 250m pixel Terra mean cloudiness on left (2019-20 imagery sampled every 5 days approximately, 276 total images) and Sentinel 30m imagery mean cloudiness (mean based on 117 images) on right. Despite using fewer images, better depiction of detailed cloudiness associated with topography is evident in Sentinel-based mean. The Sentinel mean resolves the wave-break zone on the outer reef zone in some parts of the islands. This, in fact, might be useful information on the width and location of such surf zones around islands.
Sao Miguel, Azores_170thresh_117images_30m
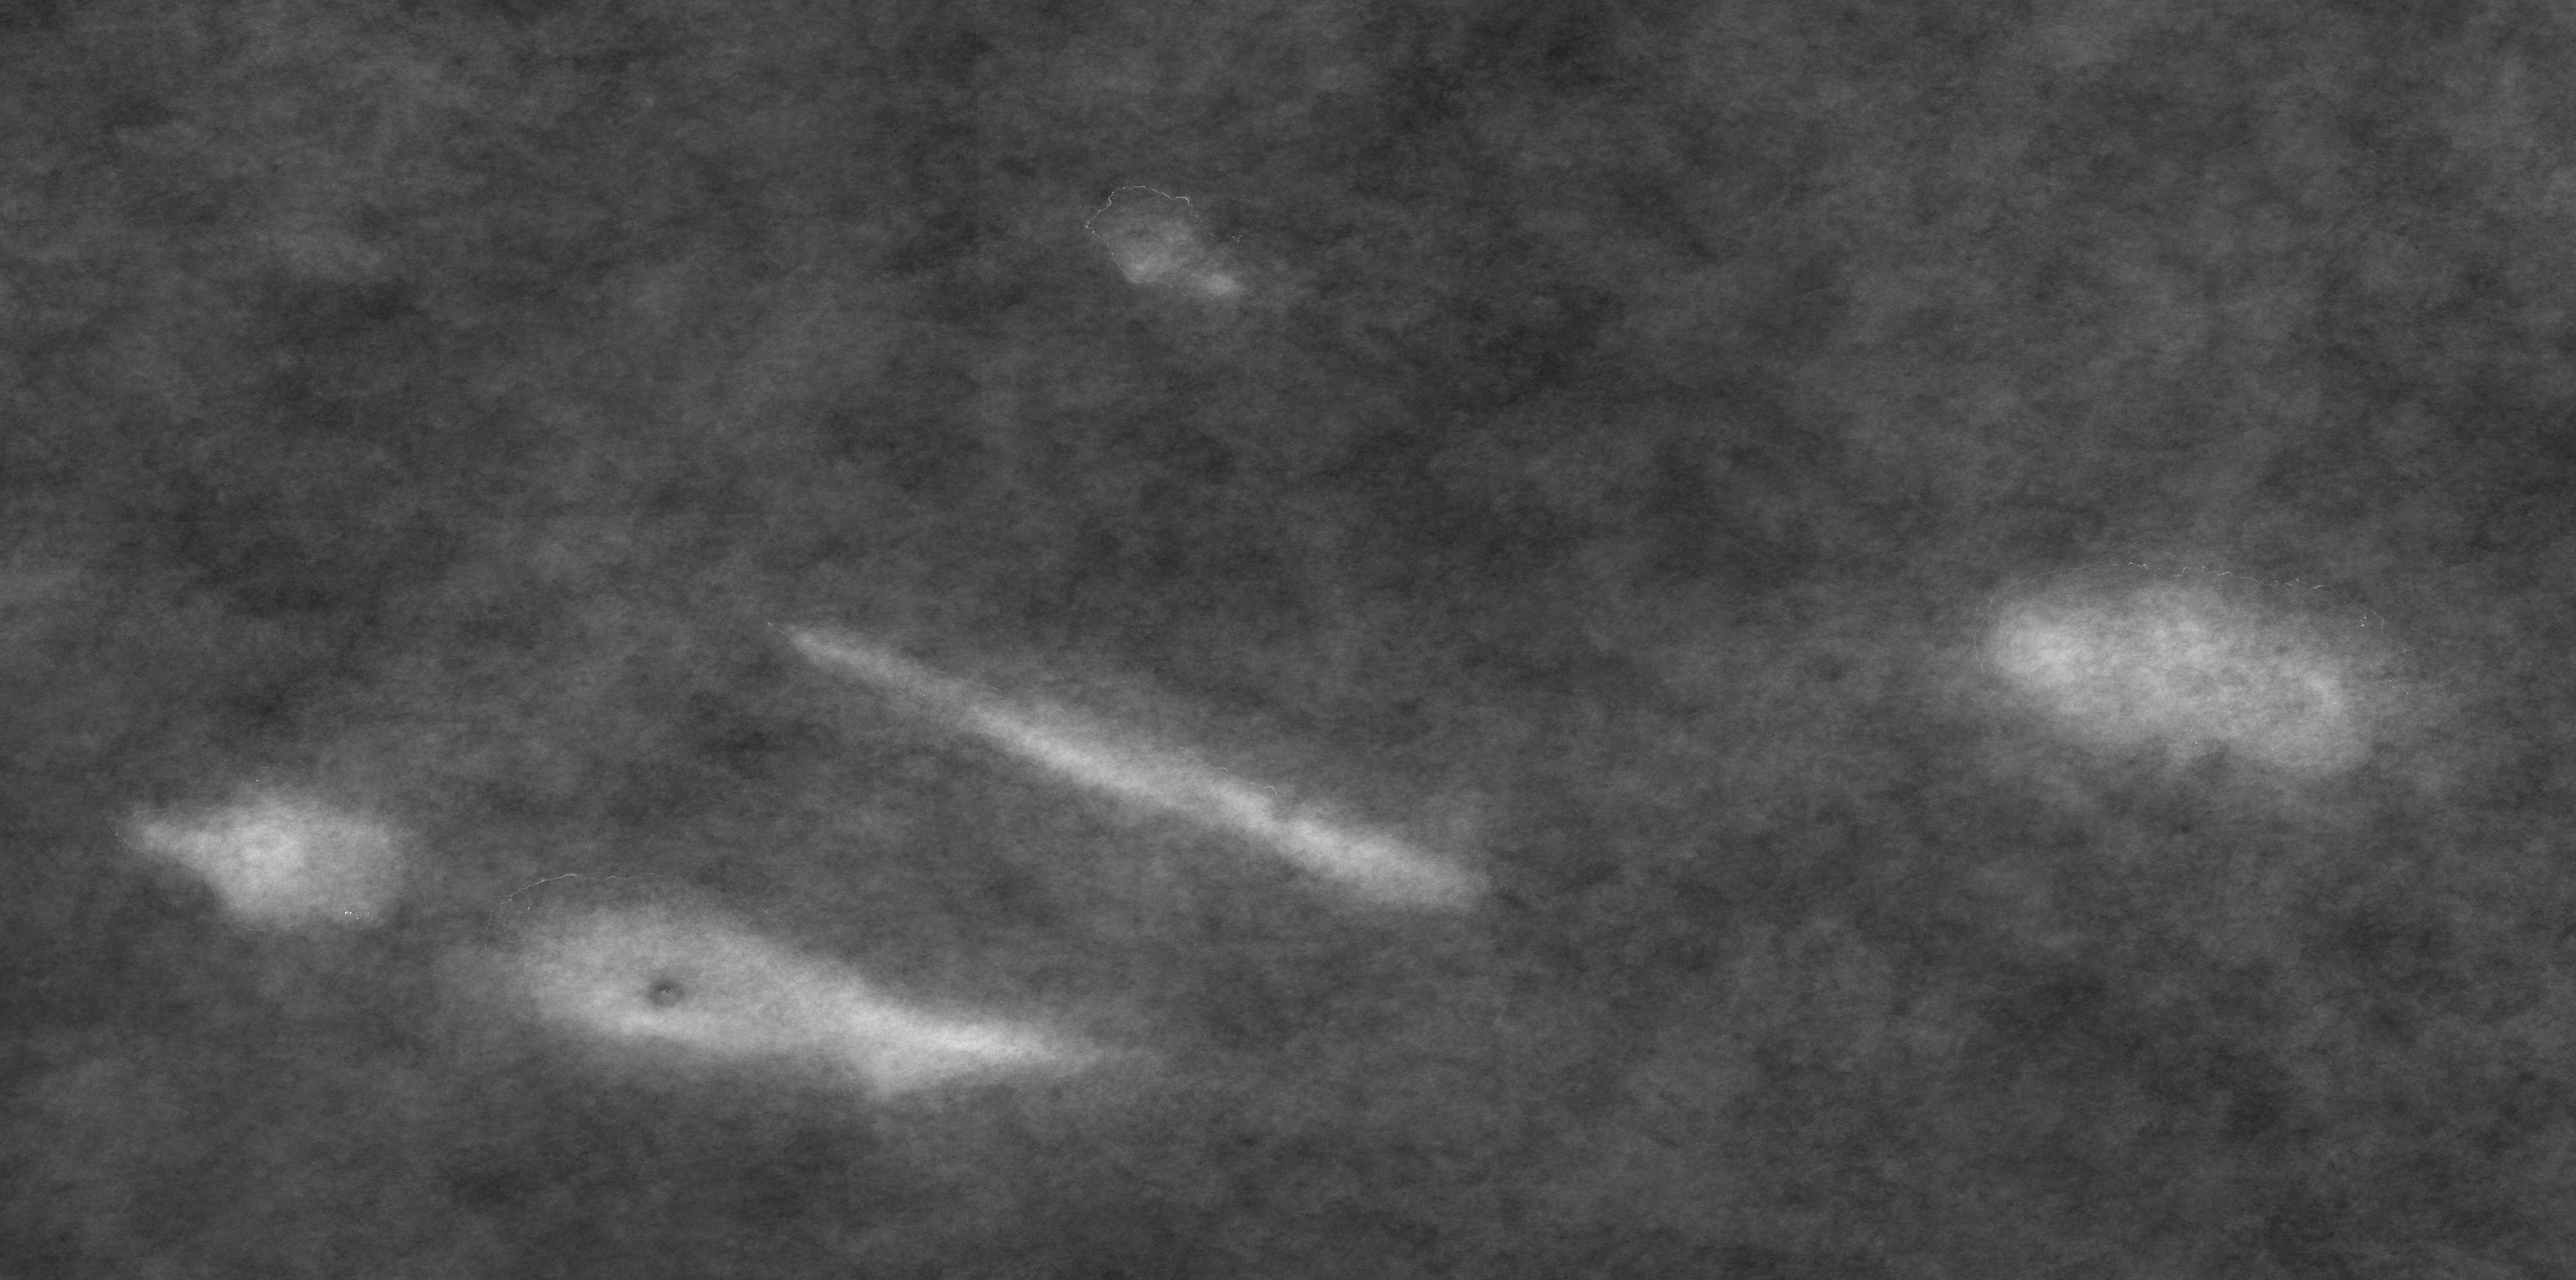
Western Azores 170thresh_106images 60m

Madeira_170 thresh_136 images_30m

La Palma, Canary Islands climatology – average of 116 images with a 170 threshold applied. 30m Sentinel 2 data.
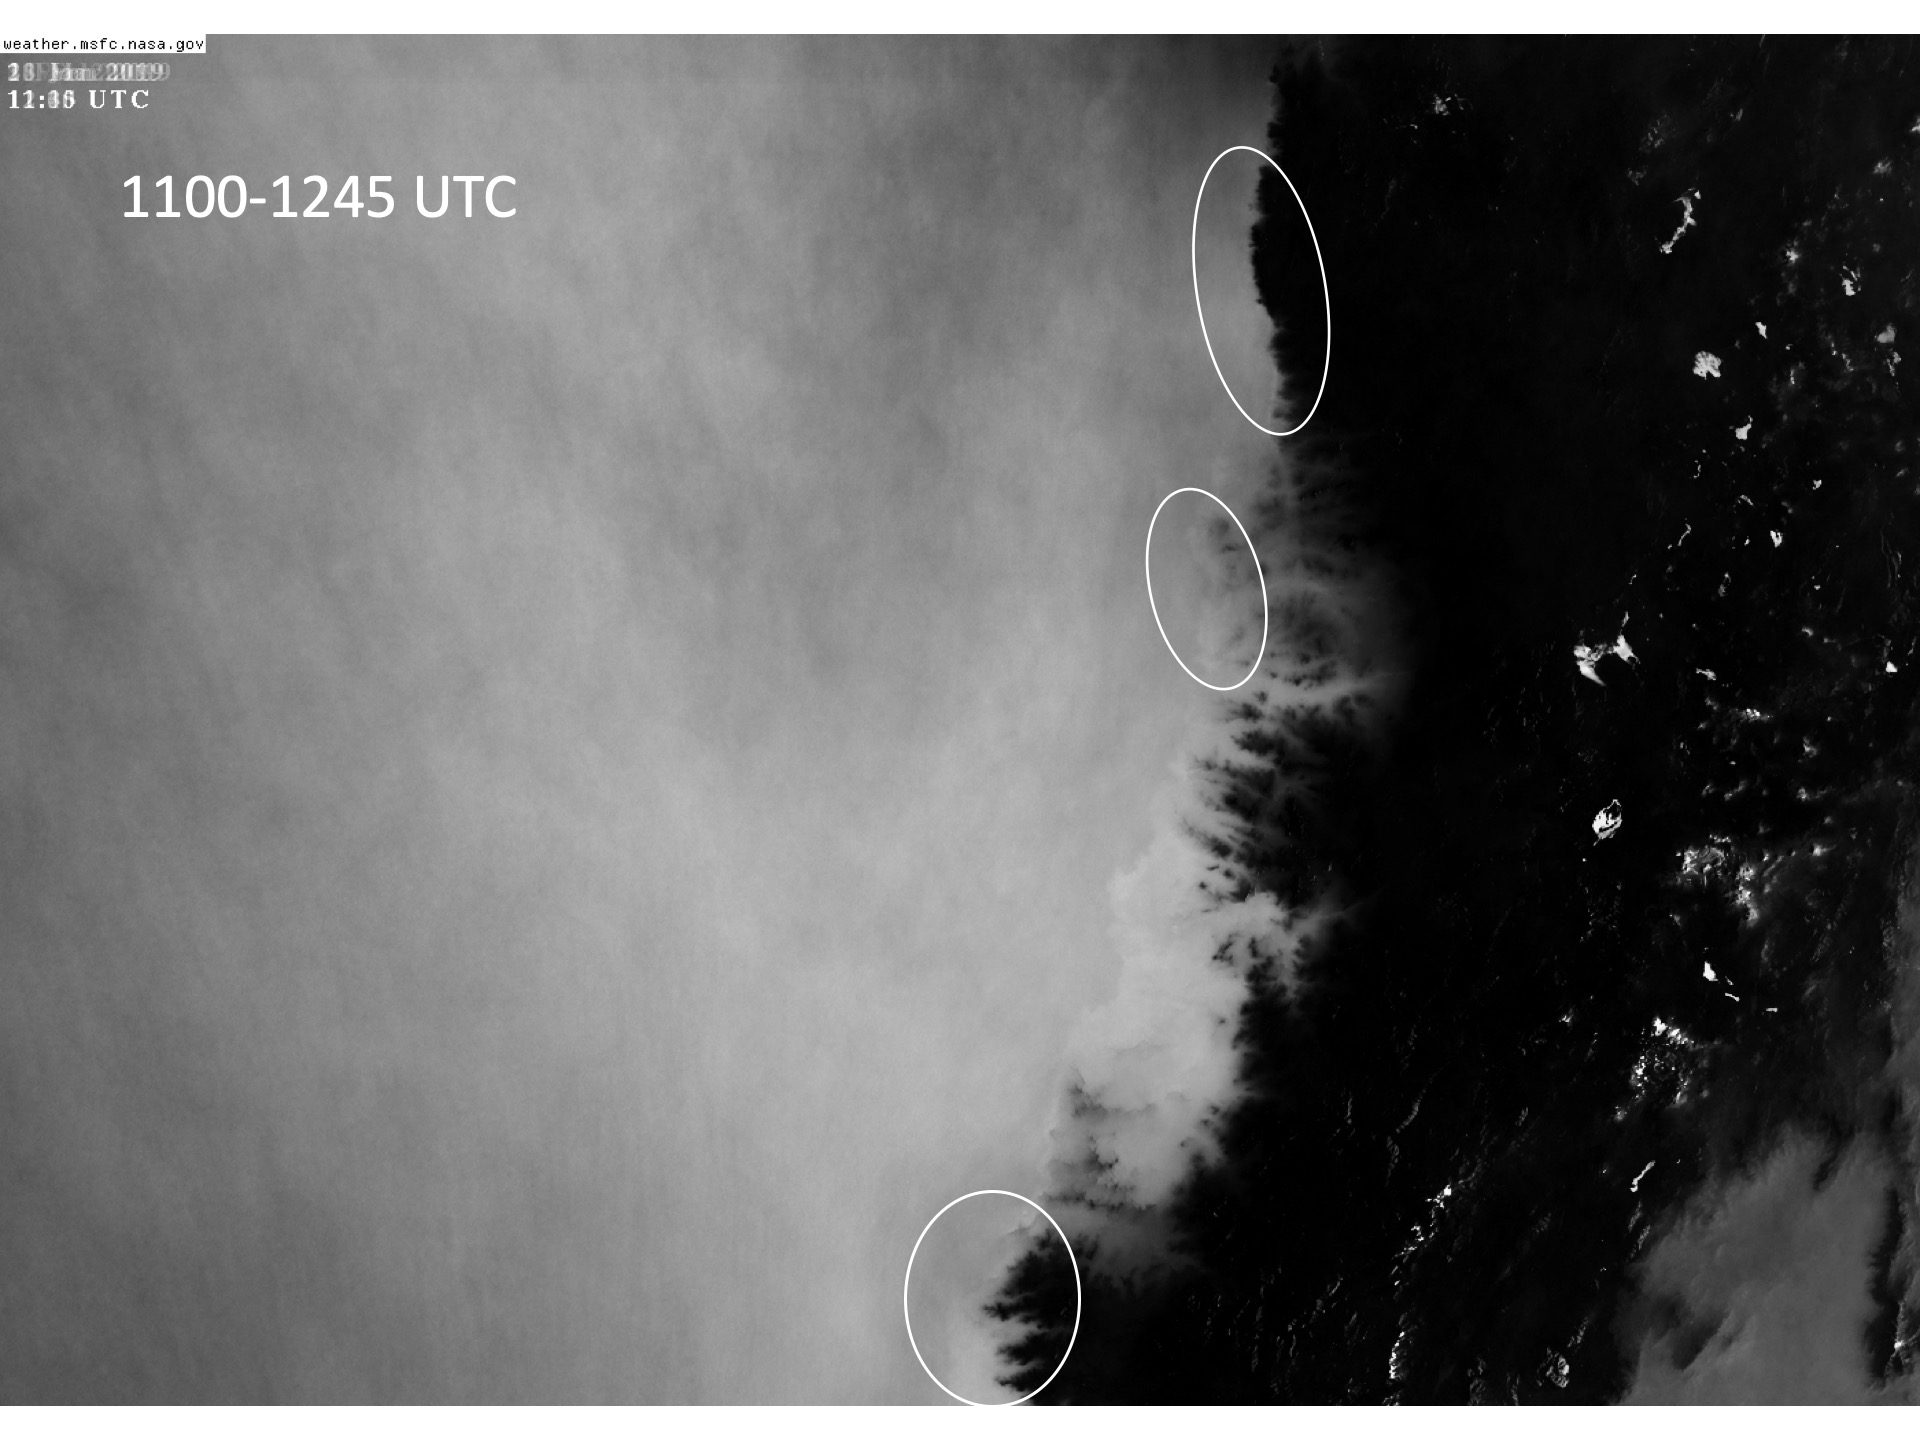
Although the Sentinel imagery provides the highest resolution for late morning cloudiness, one should recognize that this can be misleading in areas with large diurnal variations in cloudiness. The slide show below shows cloudiness from GOES 500m resolution imagery for a region of the Chilean coast. The first image shows early morning cloudiness, while the second image shows late afternoon cloudiness. The early morning inland penetration of the low clouds would not be apparent if mid-day cloudiness only was considered. As a result, Sentinel mean cloudiness patterns will tend to underestimate the importance of cloudiness and fog drip in such regions.