This will be short for now. Just a link to the satellite imagery animations for sectors from the GOES-East satellite that cover the eclipse track over South America. Also, some climatologies of December cloudiness based on a polar orbiting satellite (Aqua, that makes daytime observations near 1:30PM local time). And anything else I forgot to put in…
Animations
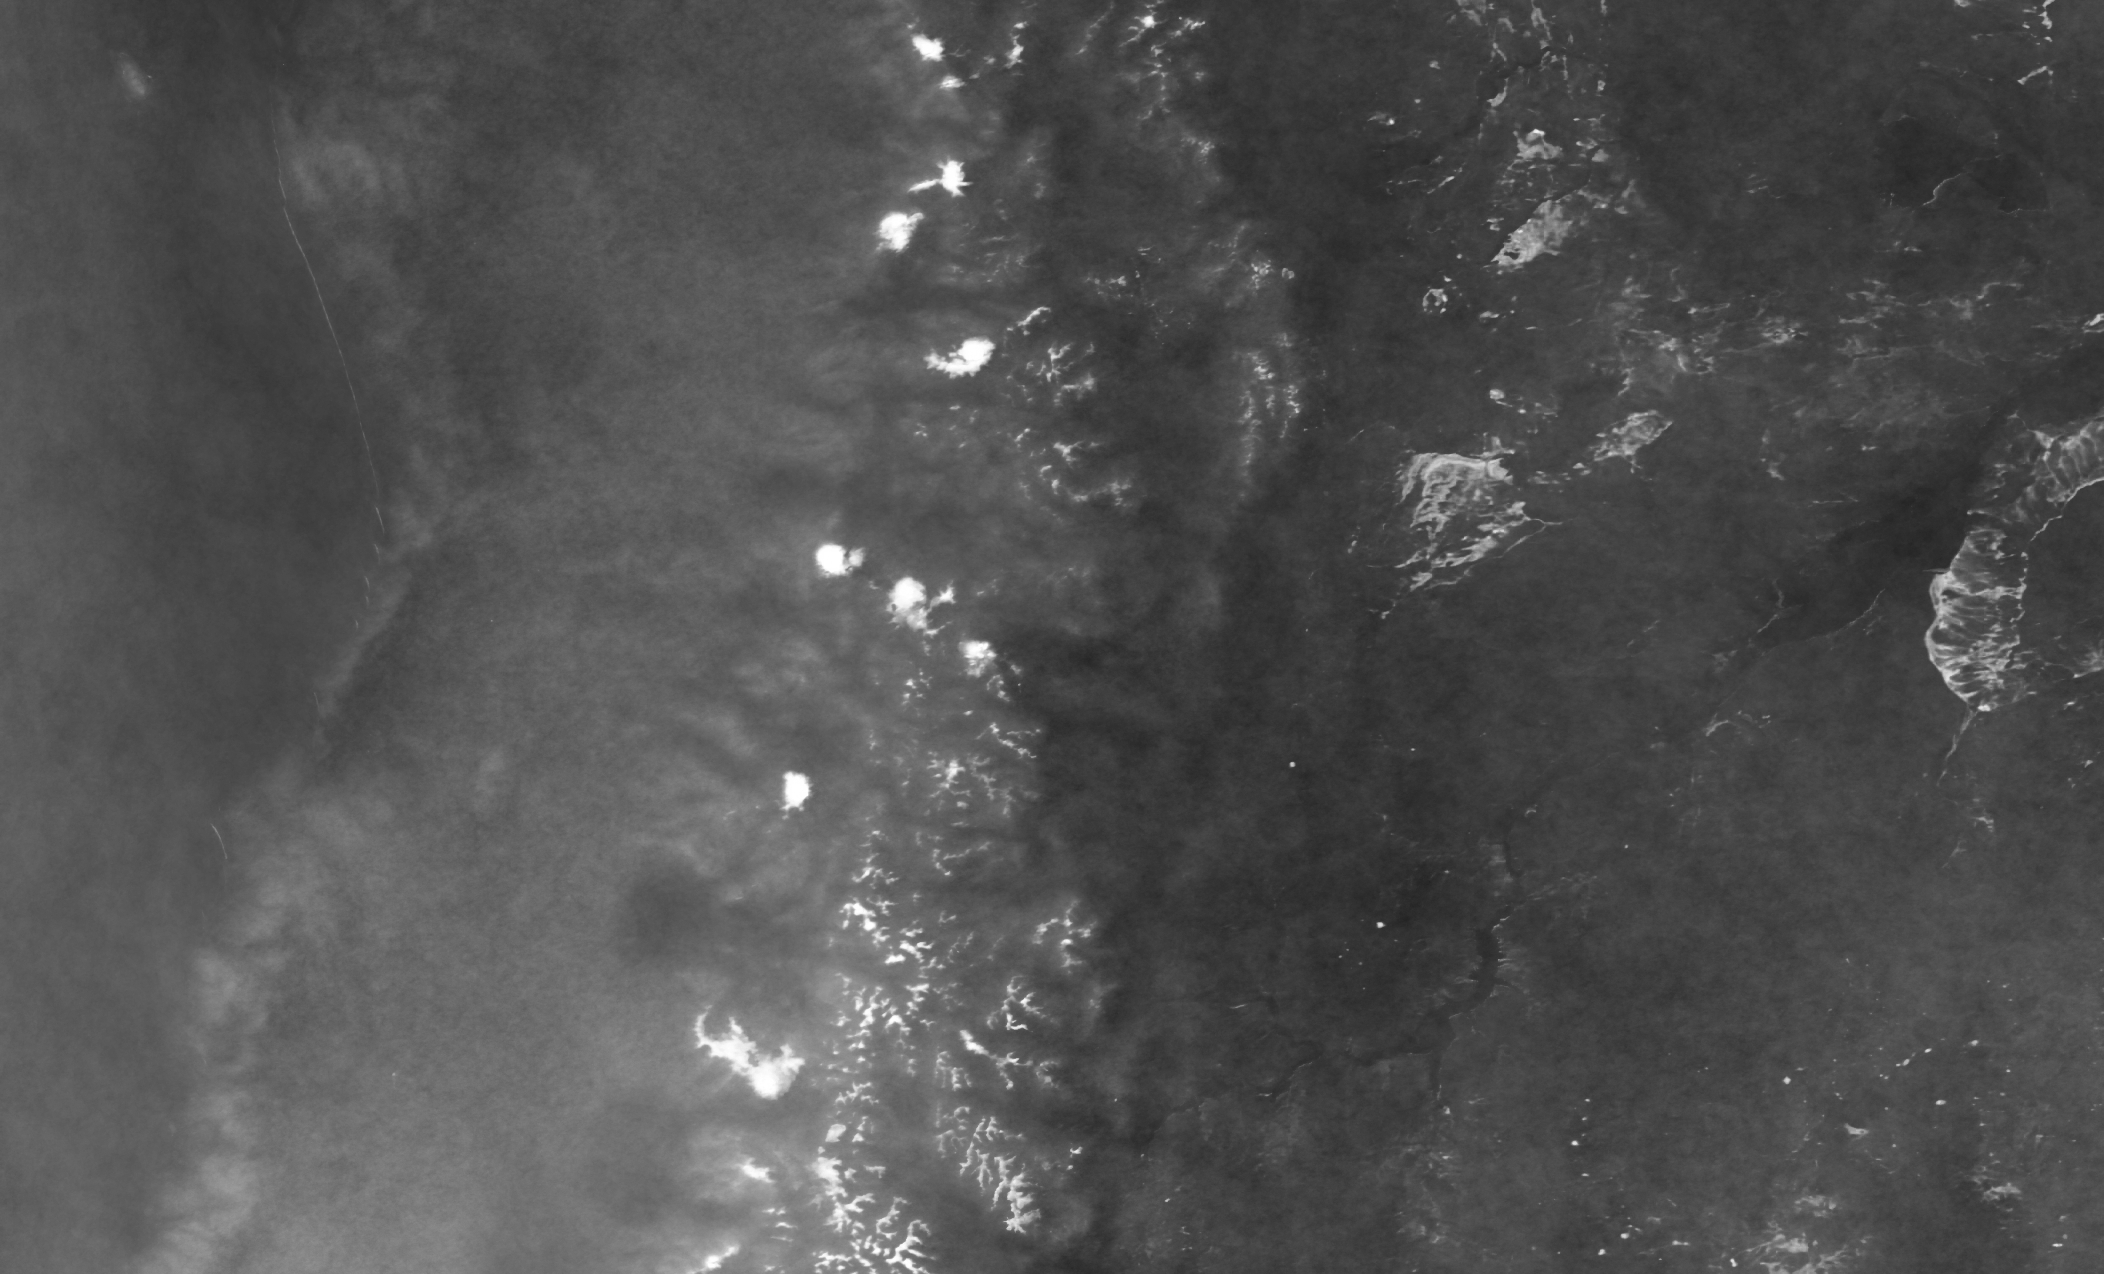
The first three sectors below are visible imagery animations based on 10 minute imagery from the GOES East geostationary satellite. The last is an infrared loop that depicts best high cloudiness at any time of day. To understand better how to modify the animations (longer loops or a different domain) please see the main page for these (and many other) loops here. IF THE FIRST THREE APPEAR BLACK – COME BACK DURING DAYTIME!
Chile and part of Argentina (500 m res)
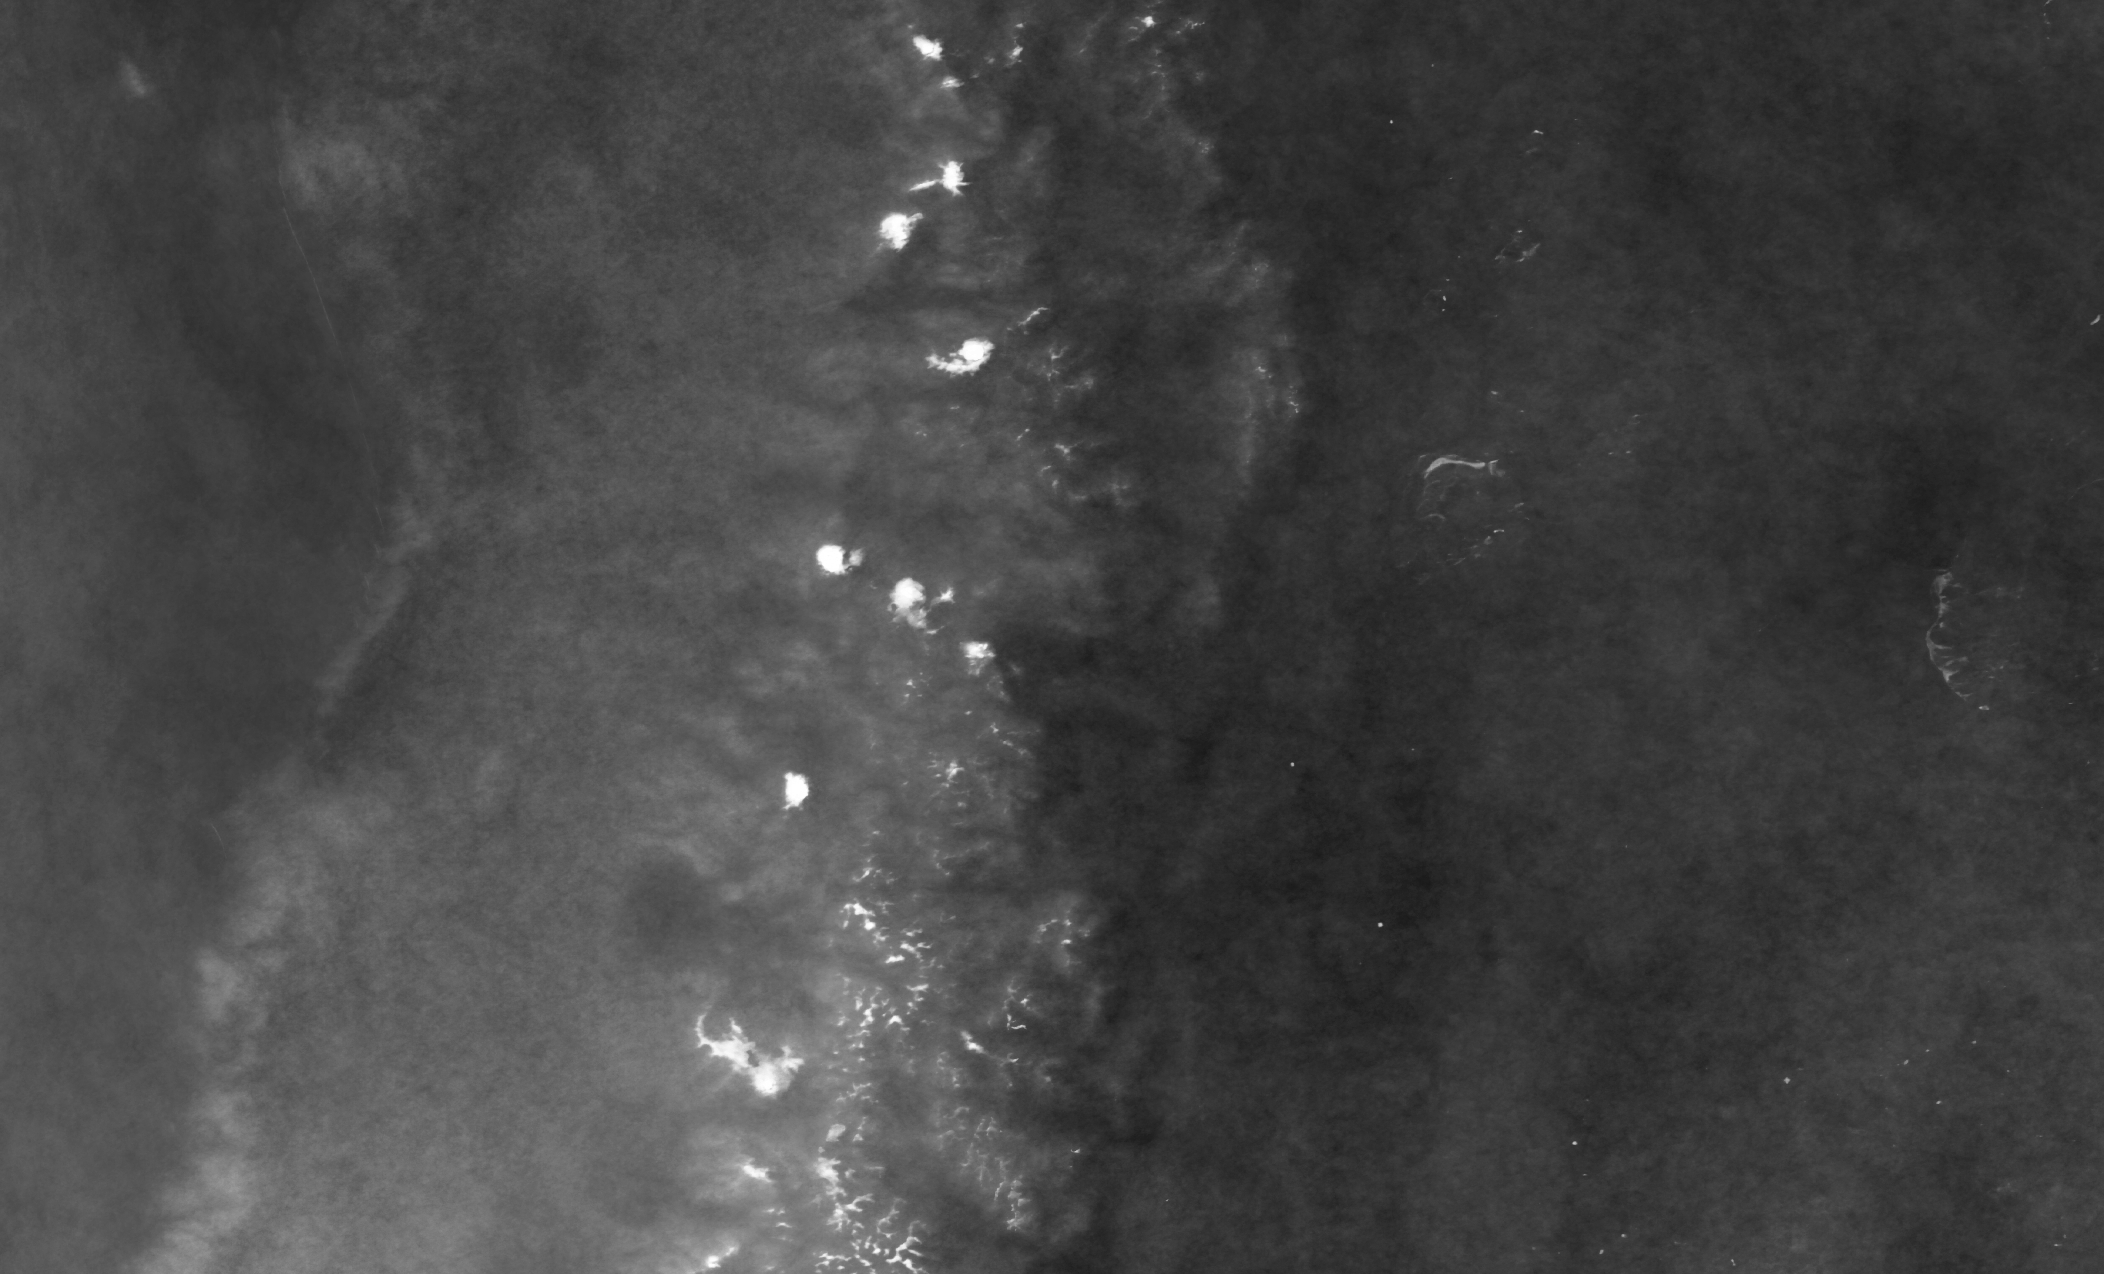
Argentina (eastern part of totality path) (500 m res)
Entire South American path (1 km res)
Infrared sector (easier to see thin cirrus) (2 km res)
Climatology
A basic climatology of December images (using the Aqua sun-synchronous polar orbiting imagery obtained near 13:30 local time) for the years 2003-2019 (minus the year 2011 that was affected by a volcanic eruption and ash effects) is shown below and the kmz file for display in Google Earth is here. The kmz file includes the eclipse track from Xavier Jubier’s website and several multi-year cloud climatologies with different cloud detection thresholds. They all show similar cloudiness patterns differing only in the amount of “contamination” from bright land surfaces. I included these to convince the viewer that the cloudiness patterns aren’t strongly dependent on the brightness threshold chosen to detect the clouds in each image. Also, one sector is with 500 m pixel resolution and this covers a larger area – to the Atlantic. It is based on 2013-2019 imagery for December. (I could have extended it back to 2003 with similar satellites but I got lazy and the patterns weren’t changing as I added years…)
140 threshold note the darker (less cloudy) lakes west of the main Andes. Mountains are white (snow counts as clouds in our threshold technique for detecting clouds). Bright land surfaces in the dry Argentinean landscape are also detected with this 140 grayscale threshold (255=white, 0 = black). Thus 100% cloud cover corresponds to 255 grayscale (white) 50% cloudiness is 128 grayscale etc… click on image for larger view – or explore the kmz file.
160 threshold Same as image about except with 160 as cloud detection threshold. Most bright land artifacts over Argentina are eliminated with this threshold.

180 threshold No artifacts over Argentina now (except for snow over Andean peaks). But the basic cloudiness patterns are the same. It is less-cloudy (darker) east of the Andes in Argentina. (So why are so many people going to Chile?)
For those unable to access or display the kmz file, here is an approximate eclipse path on the 180 threshold climatology:
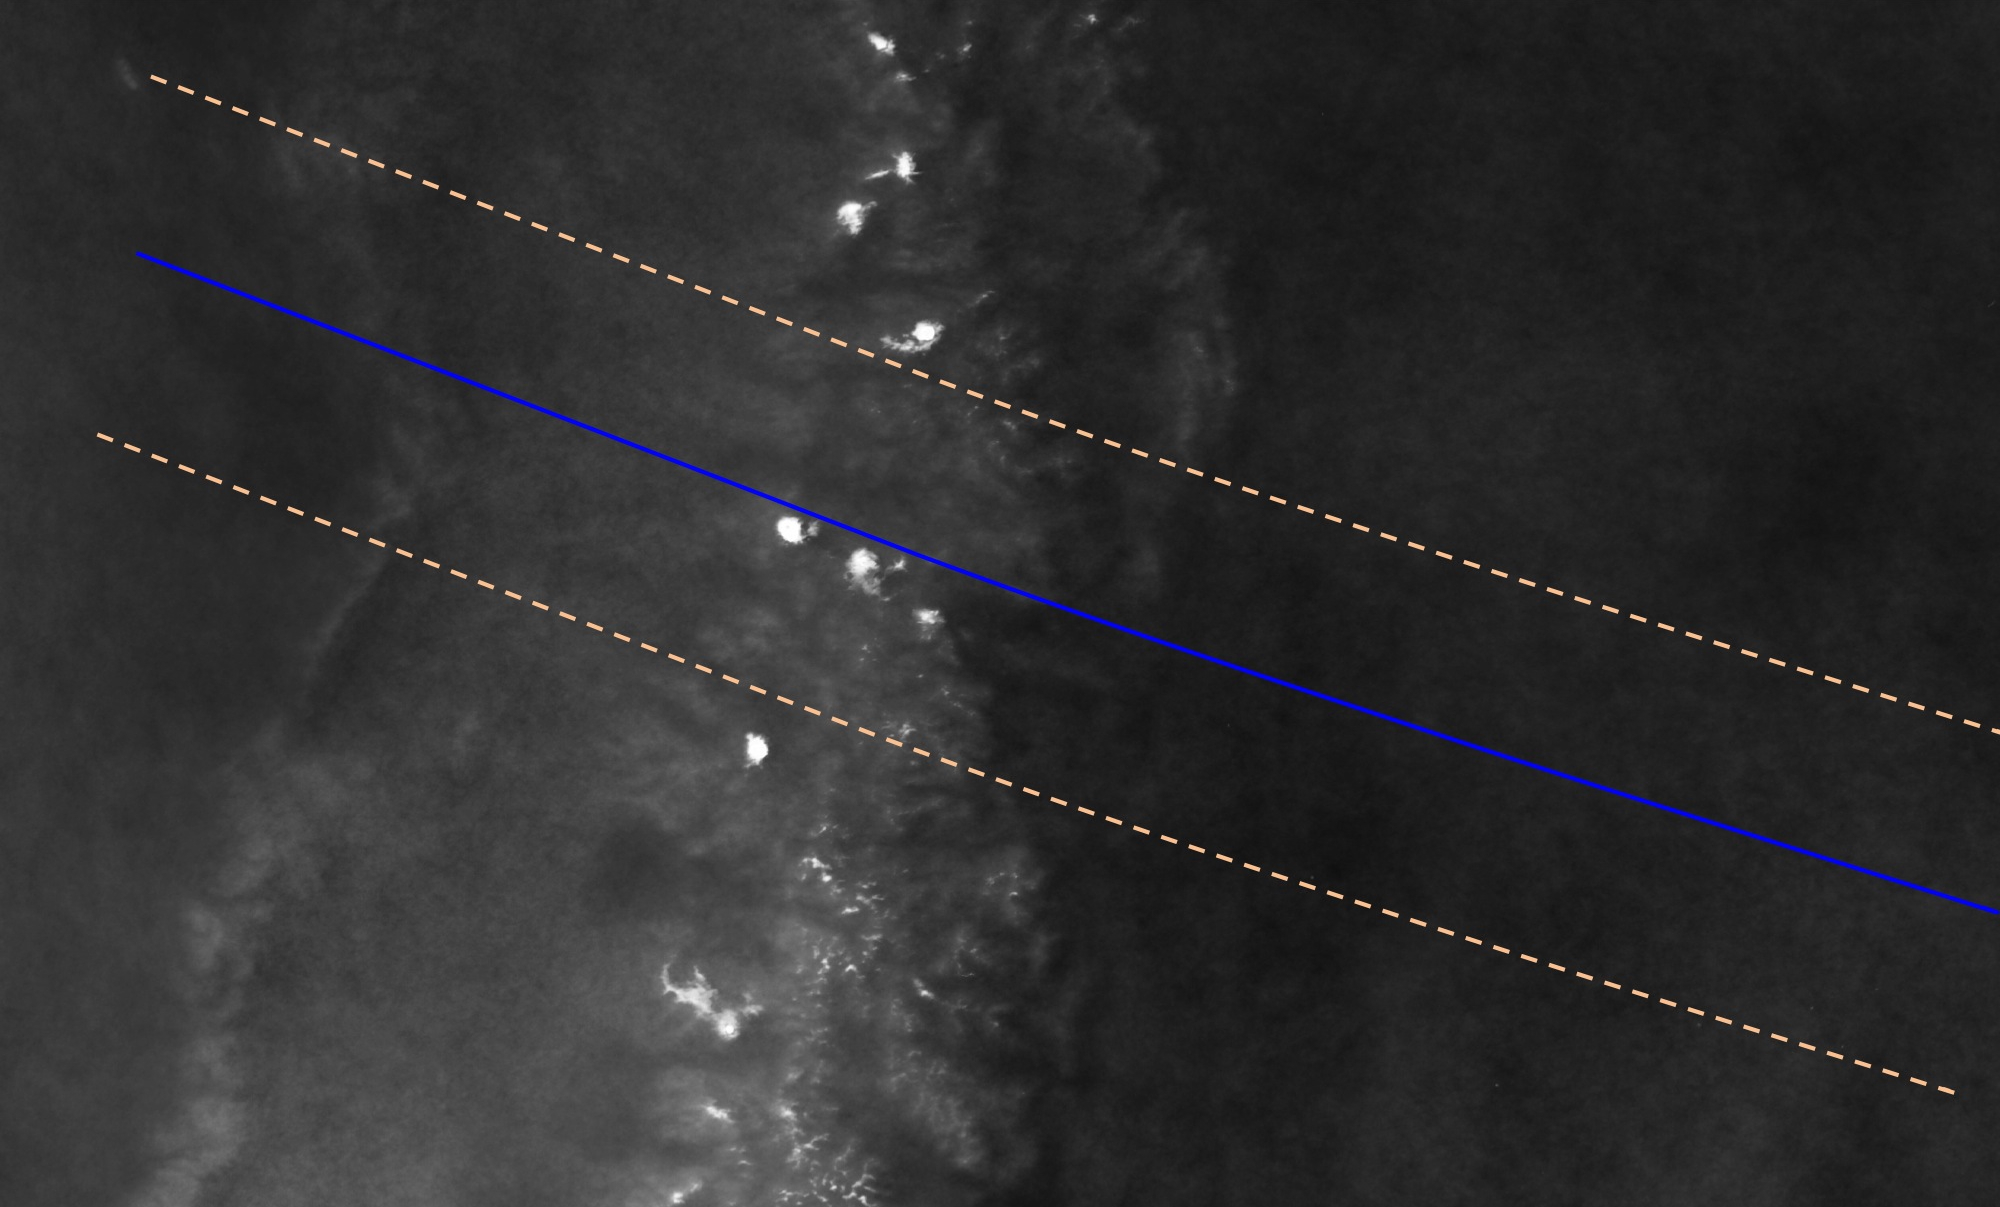
180 threshold climatology with eclipse path (“eyeballed” from Xavier Jubier’s tracks on Google Earth.) Close, but the kmz file display is better. Have you got the hint yet?
I realize it is hard to make much use of the cloud climatologies above – without some basic geographical references. So the following figures are provided. Click on the first image and step through them. This should help (though it still doesn’t show some towns like Pucon).


The mean cloudiness for the entire South American eclipse path with 500 m pixel resolution for the December imagery for the years 2008-2019 is below. I’ve put the principle roads, political borders and towns.
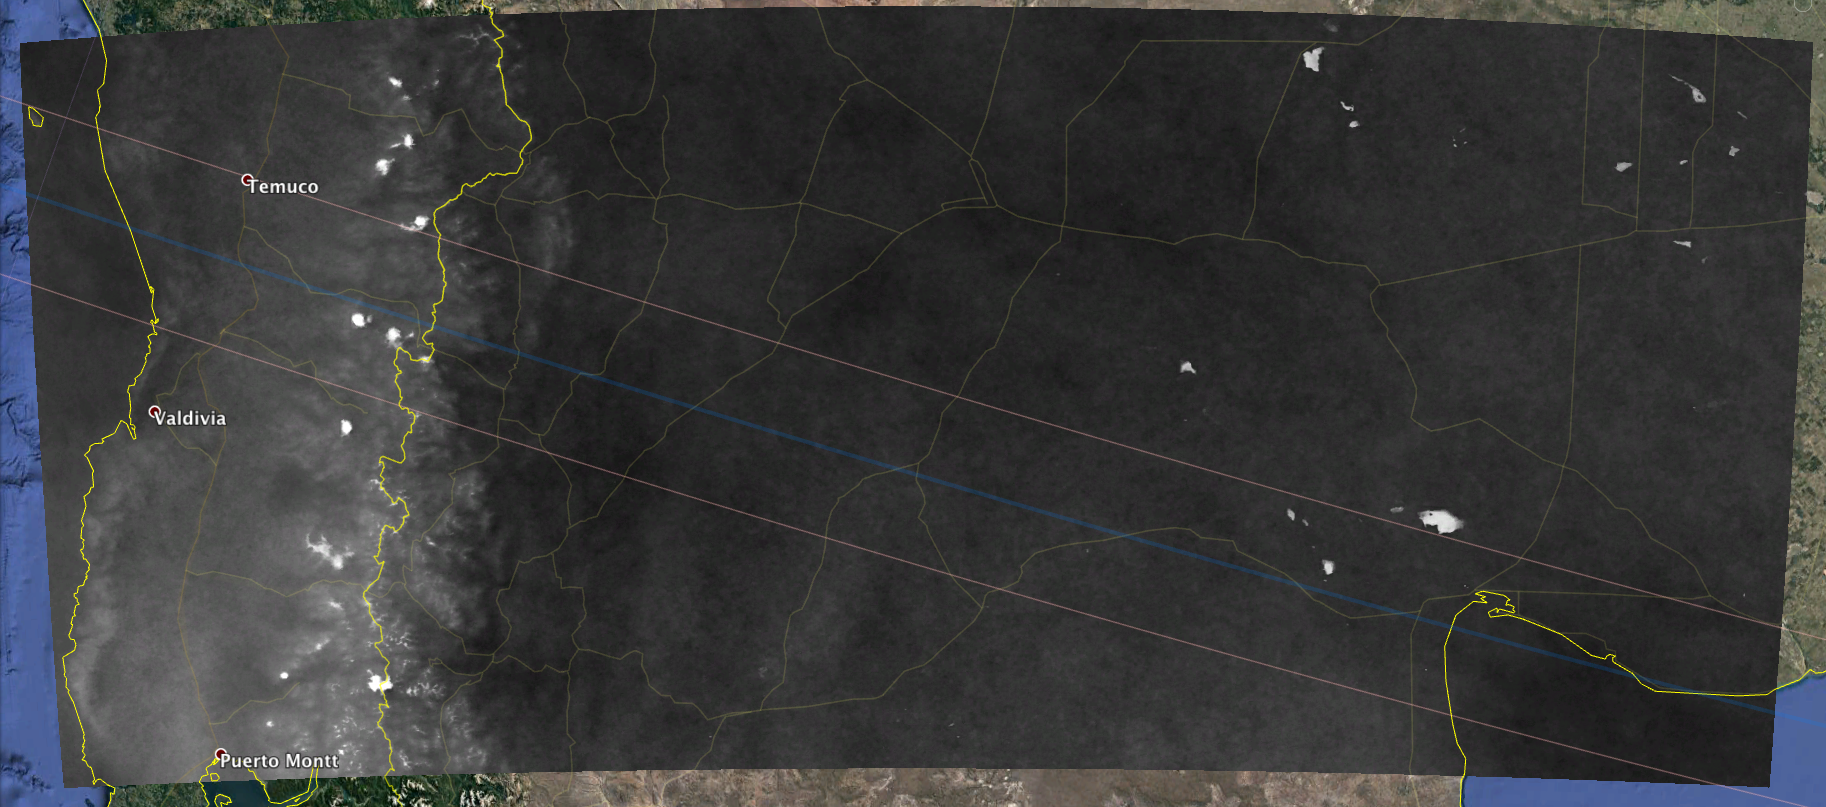
Mean cloudiness for December months for 2008-19 using cloud detection threshold of 180. Pixel resolution is 500m. Totality centerline and path width from Xavier Jubier’s site. Principle roads and a few towns also shown. Brighter grayscale is more cloudiness, darker less. If you download this image and check the pixel brightness (range between 0-255) and multiple this value by .3922 (100/255) you get the frequency of cloudiness in percent. Cloudiness values range from lows near 10% to maximum cloudiness values near 40% (excluding ice fields over mountains and salt flats over Argentina).
I also did something similar to what I did for the last Chilean eclipse. I looked at the years from 2002 to 2019 for Dec 14th to get a really rough idea of the variability one might expect. Step though them by clicking on the first image below. The eclipse track is superimposed on them.
If you step through the images a few times you will realize that some years (2002, 2006 and 2017) have lots of clouds all over. These are examples of “synoptic-scale” cloudiness associated with large-scale weather systems. Fortunately this scale of cloudiness can be predicted a few days (or more) in advance with weather prediction models. Some other days (2003, 2012, 2015, 2018) have clouds mostly on the Pacific side of the Andes. This is why the climatology looks the way it does. If the eclipse days was such a day (and if you knew it the day before) you could escape eastward to Argentina to see the eclipse (forfeiting your expensive Chilean lodging) for the comfort of your compact car.
Some days are almost entirely clear (2007, 2008, 2009, 2010 and 2013) and hopefully the weather predictions will tell you this a couple days in advance. You stay put and enjoy yourself on eclipse day. The remaining days are those where decisions are difficult (2005, 2014, 2015, 2018, 2019). Note that even if the cloudiness is mostly on the western side of the mountains, you have a fair chance of cloud-free conditions if the winds are weak and only cumulus populate the sky. The large Chilean lakes are relatively cold compared with the land and cumulus will form over the land. Winds off the lakes will be relatively cloud free compared with over the mountains. So valley floors and the vicinity of larger lakes will be your best observing bet. Pucon looks good under such situations. The cloud formation does depend on the prevailing wind direction and can mess with this simplified conceptual model but the near 1 PM totality time favors this pattern.
The main point for 2020 eclipse-chasers is that the most cloud-free regions lie just east of the Andes… in Argentina. This cloudiness, based on the grayscale values of the 140 threshold climatology, is something like a 40% chance of clouds over Chile and 20% over Argentina – very roughly speaking. Don’t quote me! You will also see (especially with the kmz file!) that the Chilean lakes are minima in cloudiness (cooler water than surrounding land inhibits daytime convective cloud development). There are some small islands in these lakes so if you really don’t plan any last minute position adjustments these might just be the spot for you!
Of course, Chile has many more touristic facilities compared with the Argentine steppes. But there is only one border crossing between the two countries near the eclipse path, so last-day changes might be difficult to make. My suggestion is to pay close attention to detailed weather forecasts a day or two before the eclipse date and position yourself accordingly.
