Some of this material can be found in: https://thetravelingnaturalist.org/cloud-climatologies-of-select-areas-using-sentinel-imagery/. and also in the page on biodiversity and citizen science observations: https://thetravelingnaturalist.org/biodiversity/.
The fundamental hypothesis here is that volcanic landforms undergo an evolution from high symmetry when they are active, to highly irregular relief when they are at an intermediate stage of erosion. This intermediate stage has the greatest diversity of climatic conditions, not only slope and aspect relative to the sun angle, but the induced cloudiness. Finally, their relief becomes small and they no longer affect the cloud-climatology of the landscape.
Here, we will aggregate a selection of volcanic cones that have high symmetry – indicating they are relatively active with recent eruptions, and cones with greater degrees of irregular relief.
Two abstracts are being considered for the IBS meeting in Denmark in January 2026. They are below in draft form. (I decided the material wasn’t ready. The reader will agree!)
Abstract 1: Tweeking the volcanic island model to include island-induced climate changes.
Volcanic islands undergo an evolution of their landscape, from initial active volcanic cone to an increasingly more eroded edifice, to a final stage near sea level with minimal relief. This can evolve further, into subsurface guyots in higher latitudes or into atolls, in climates where reef-building corals are supported. While this oceanic evolution is supported by geological evidence in a host of archipelagos, some important details remain regarding the hypothesized evolution of species on such islands. The greatest diversity of relief, and expected abiotic niches, should occur on islands of intermediate age – before they are eroded to low-altitude, relatively flat islands. These abiotic niches are relatively predictable – at least factors like slope, orientation, and altitude. These in turn control aspects important for life like surface temperature, run-off, and available sunlight. However, one important factor has been left somewhat unmentioned – how islands modify their local climates as they age.
Based on satellite imagery derived cloudiness, this note describes aspects of the climate of tropical and subtropical islands during their stages of decay towards atolls. Using Sentinel 30m or 60m pixel resolution imagery, multi-year averages of visible cloudiness have been derived for select islands – both oceanic and tropical sky islands. The greatest spatial diversity of cloudiness is associated with the high relief stage of island erosion. Not surprisingly, highest average cloudiness associated with volcanic landforms is associated with steep slopes resulting from erosion of initially more symmetric volcanic cones. One might speculate that there is a positive feedback between the cloudiness and erosion of the underlying surface. An interesting aspect of this study is that high spatial resolution imagery like that from Sentinel or Landsat can be effectively use to derive mean cloudiness “climatologies” from only a few years of observations made with imagery available only every 5 days.
Need to show that active, simple-slope volcanic islands have simple cloud climatologies compared with those that have more evolved, eroded slopes. Flatter islands have lesser cloudiness, but size greatly affects tropical island cloudiness. These are conceptual ideas that are hard to generalize because island diversity and geography are a result of geological processes that are not predictable over deep time.


FIG 1a: Cloudiness about smooth/recent volcanic cones or islands. the left image is Bioko Cameroon, a large active volcano. The right image is the island of Sao Tome, more eroded. The difference in small environmental niches (at least those that might be associated with cloudiness variations) is apparent. (Figure needs more work)

The volcano Tambora in Indonesia produced in 1835 arguably the largest volcanic eruption in recent history. The ejecta from the eruption created a smooth south and east facing slope, while the northern side of the volcano was highly eroded (or was already this way prior to the eruption). The resulting mean cloudiness shows the importance of steep slopes and canyons in modulating the cloudiness compared with the relatively uniform cloudiness on the south side.
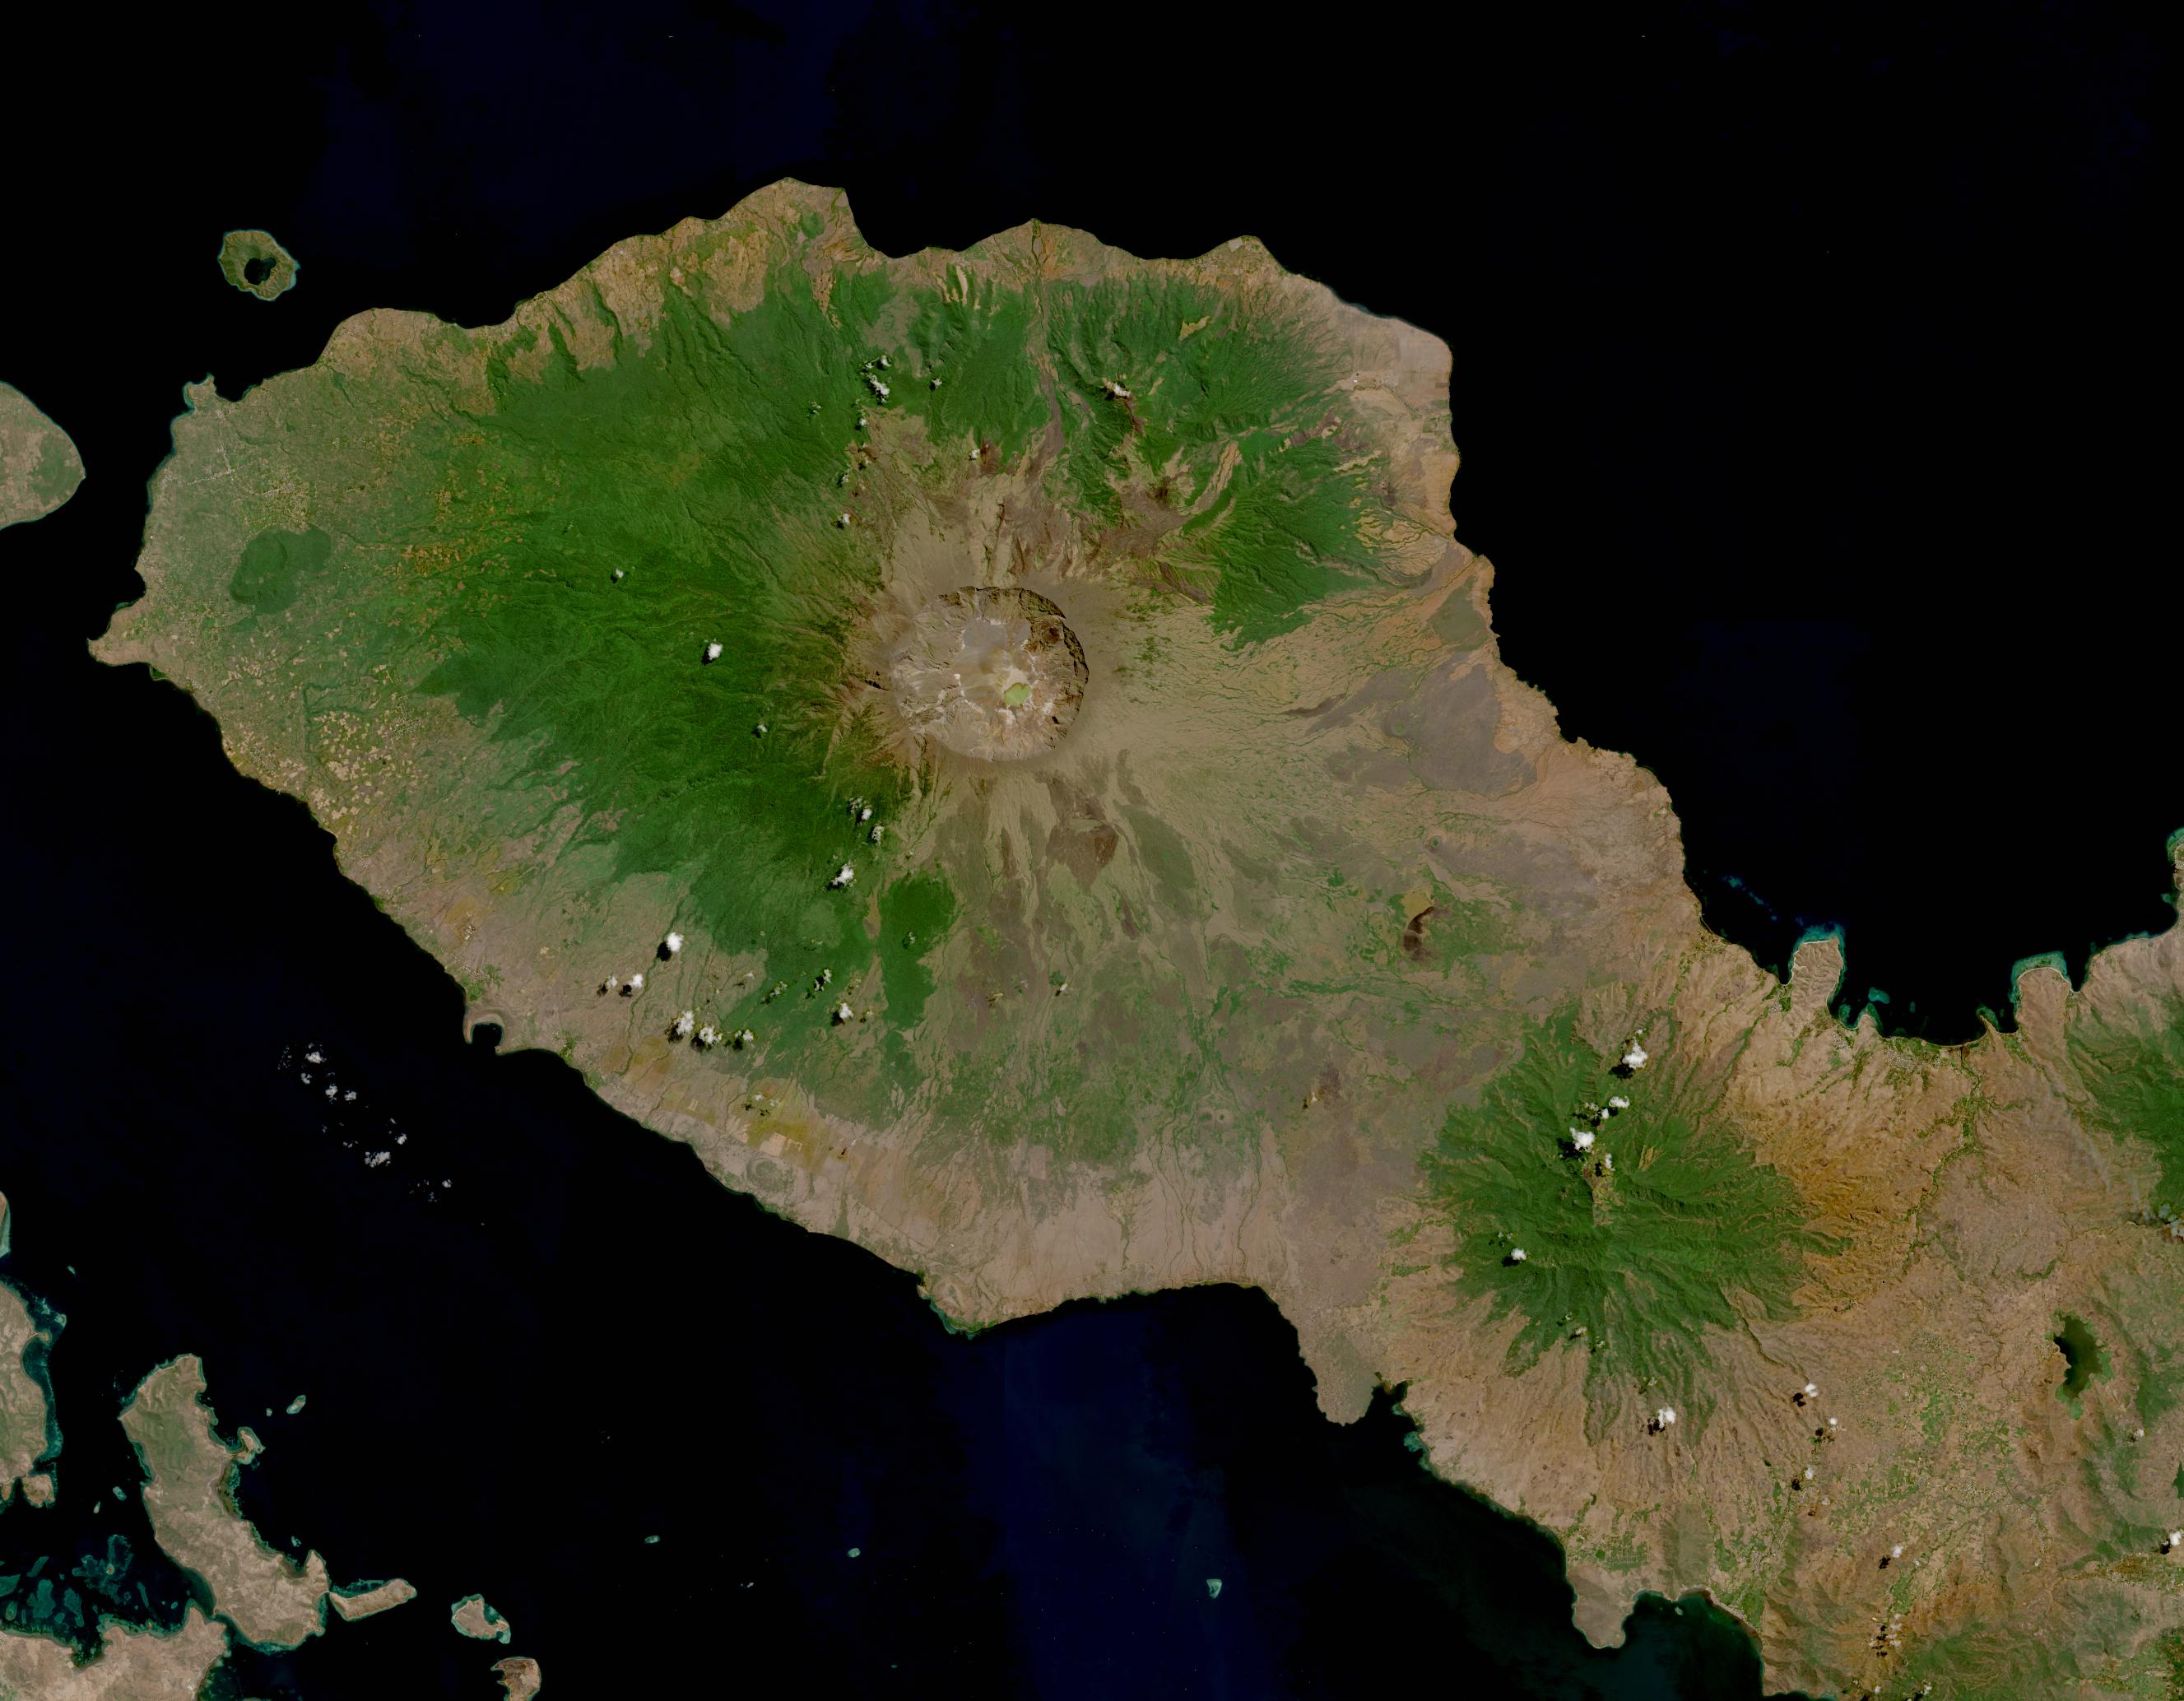

Fig 1b: Cloudiness associated with the volcano Tambora. Slide the divider to compare the visible image with the mean cloudiness.
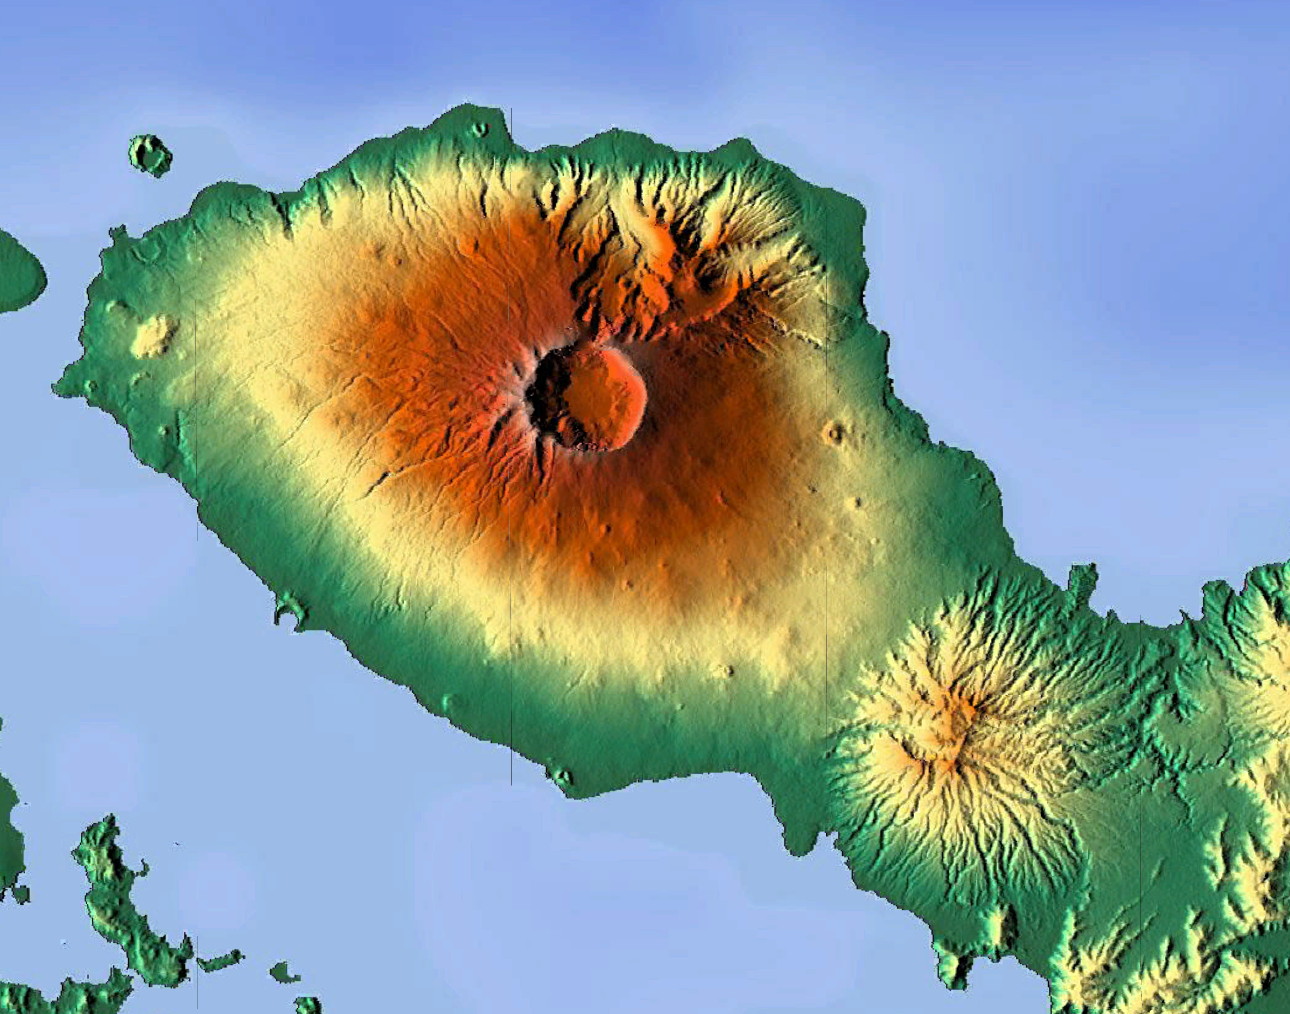

Fig. 1c. Comparison of shaded relief and cloudiness for Tambora. The smoothest slope is on the south to east side of the cone.
Abstract 2: Biogeography and public outreach. Local to global strategies.
All studies of biogeography depend on observations of life forms on Earth. Such observations have historically depended on museum specimens whose classification falls into the subject of taxonomy. Despite several centuries of collecting, there remain a dearth of observations from many parts of the world. In the last few decades citizen science applications have allowed citizen scientists to make observations of biota. Despite their enormous and growing numbers, there are many problems with such observations. Here we summarize key issues with these rapidly increasing observations and provide ideas for improving their quality, quantity, and global distribution of such observations.
global reach of iNat and ebird type apps
It is clear that citizen science apps like eBird and iNaturalist have been generating very large data sets that are increasingly being used in research studies. The most important objective of these apps is to increase interest in the natural world by individuals. Without this, global nature conservation activities will have little chance of success. This note discusses some shortcomings of these apps, which if remedied, may greatly increase the interest generated in nature conservation.
The three issues needing improvement are 1) increasing the awareness of apps like iNaturalist by the global audience, 2) increasing the quality of citizen science observations and 3) expanding the making of observations in needed taxa and in parts of the world that are seriously under-sampled. Each of these topics is discussed below.
Increasing the awareness of citizen science applications
Most people do not know about iNaturalist or eBird. Though numbers change daily, approximately 1 million people have contributed one or (usually) many more observations to eBird. There are more observers for iNat – approximately 4 million individuals have contributed observations as of late 2025. These are very large numbers, but they don’t indicate the number of active contributors – which is a much smaller fraction. In 2024 1.1 million observers made collectively about 52 million observations. These numbers are growing rapidly, but the active percentage of the global population remains very small – in spite of the app being available in 57 languages (Aug 2025). In the USA, in 2024, 537 thousand people made about 20 million observations. This is less than .2% of the US population (compared with approximately 75% of the US population using Facebook). In China, there were only about 7000 iNaturalist observers in 2024, but there are multiple reasons for this unrelated to iNaturalist. Of course, individuals can make observations anywhere in the world so these numbers provide only an approximation to the scale of the observations being made and their geographical distribution.
Just how to increase the usage of iNat is a social issue. It isn’t needed daily, like some other apps for social media. But the lack of observations mostly reflects the lack of curiosity about the natural world and the tendency for more people to be engaged in other activities unrelated to the natural world and as a consequence of increasing urbanization.
Making observations in under-sampled parts of the world
Many biota have very limited ranges and are often described by only a handful of observations. How does one improve this situation?
Increasing the quality of citizen science observations
While increasing the number of citizen science apps is one problem that biogeographers need to consider the quality of potential observations needs to be addressed. Almost any digital camera is capable of taking an image sufficient to identify large, well-known, and frequently-observed organisms like Cape Buffalo or American Robins. As a result additional observations probably don’t add too much to the knowledge of their seasonality or geographical distribution. But as we descend the spatial scale to smaller organisms – especially insects – we quickly see that the quality of the observations becomes crucial to proper identification. Of course, many such organisms require collected specimens – something impractical for most iNaturalist users. Better digital images are crucial to improving the AI algorithms for identifying biota and for accurately identifying what is being observed. Small insects are especially difficult to identify from cell phone photos, and such cameras dominate iNaturalist contributions (except possibly for bird observations).
There are positive trends in the technology of making better insect photographs. Cell phones are gradually increasing their macro capability but this isn’t a major factor in the marketability of such phones. Digital cameras, increasing mirrorless or “bridge” cameras, can be capable of good macro photography with the proper lens. Additionally, some cameras have the ability to focus stack multiple images to increase the depth of field of the image – crucial for insect photography. However, there are currently limits to what can be done with very small, moving subjects.
data quality issues vrs generating interest among public
biodiversity data and insects
types of iNat artifacts and how to deal with them
Main problems with Citizen science obs’s: taxonomy, observation quality, gap filling, global outreach.
Summarizing, the main problems with citizen science involve classification of poorly observed organisms – often dependent on the quality of the observation, which has technical limitations. Then filling global data gaps is tied to the user community, where they live, and where they can travel to.
